This post is a follow up to our October 27th post, December Wheat Technical Outlook
Summary
All major global edible oils, including canola, face a very bullish scenario.
Adverse weather in SE Asia tied to the La Nina weather pattern and extreme drought in the Black Sea region is effecting reduced production for palm oil and sunoil.
La Nina is also creating a bullish concern for soybean production in southern Brazil and Argentina.
And finally, surging soybean demand from top buyer China has decimated Brazil’s soybean stocks and is rapidly reducing US ending stocks to only 20% of a year ago.
Technical analysis tells us that over the next few months the market should provide opportunity to extend coverage.
Fungibility
Reuters’ daily palm oil futures update often states, “The edible Palm oil is affected by price movements in related oils as they compete for a share in the global vegetable oils market.”
It’s because vegetable being fungible for many uses that our market analysis begins with a high level consideration of world supply and demand for major oils: palm, soybean, sunflower and canola/rapeseed.
Among the major oils, palm oil is by far the world’s dominantly traded oil as can be seen in the Vegetable Oil Exports chart below. Absent from this chart, sunflower oil is now the third largest exported vegetable oil globally, behind palm oil and soybean oil. Sunflower oil production and exports are growing particularly in the Black Sea region.
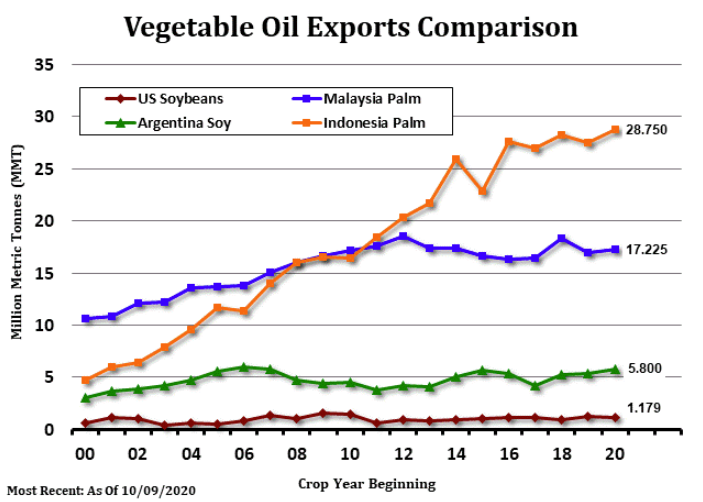
Bottom line, fungibility causes oils to trend together, though not in perfect lock-step movements. That is evidence in the following charts of historical prices for our four oils.
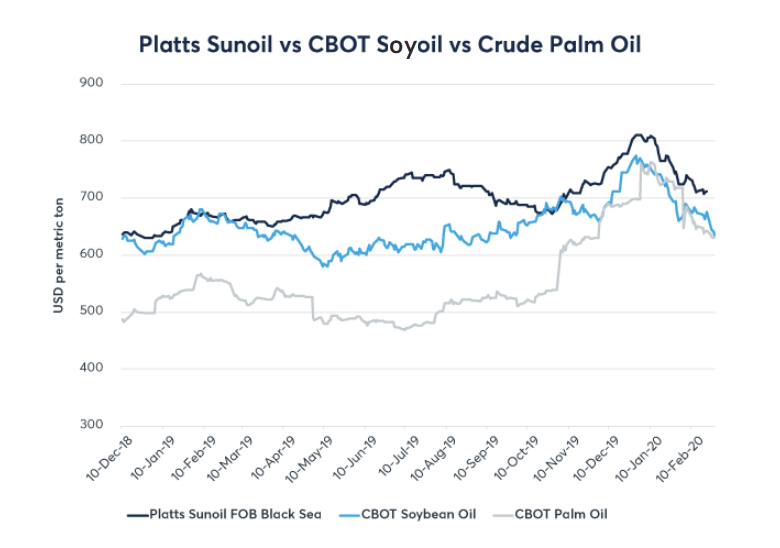
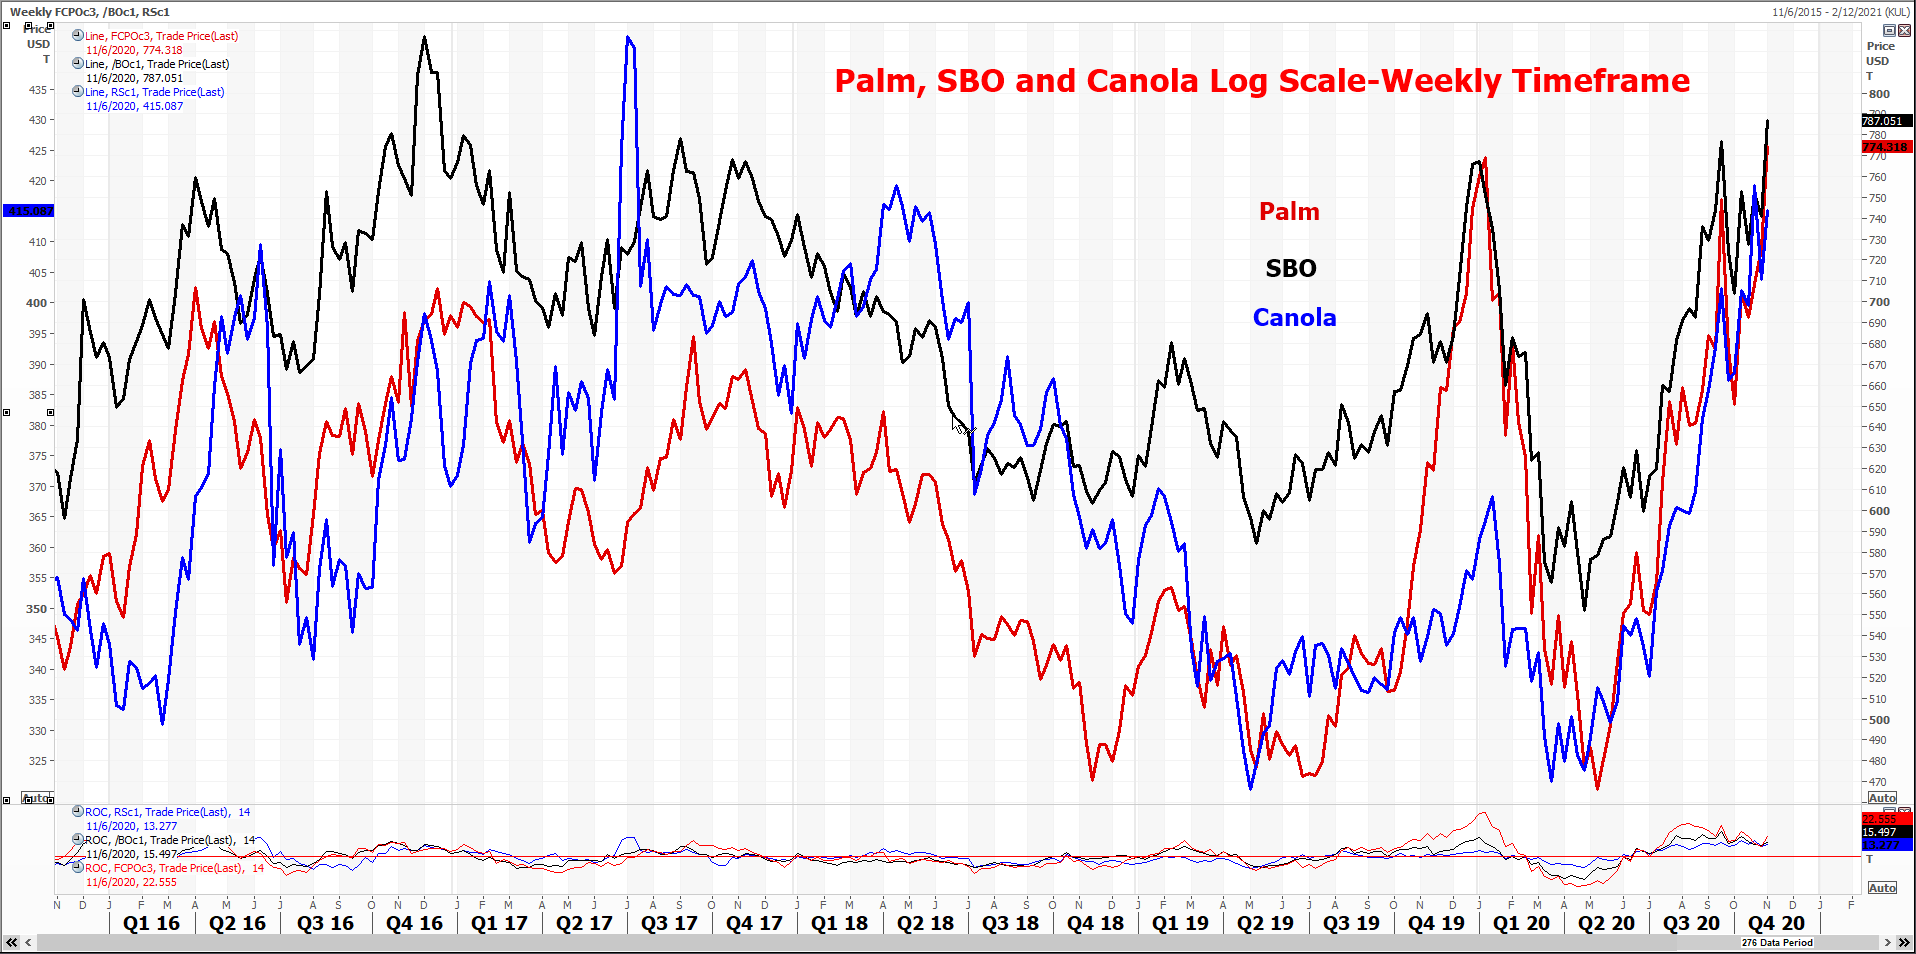
Current Fundamentals (Supply and Demand Factors That Drive Technical Trends)
Global vegetable oils are facing a “very bullish scenario” as traders are mindful of the La Nina weather pattern hurting yields with tightening supply and stocks across a number of oils, particularly in production of sunoil and palm oil.
Edible oil futures, led by palm oil, resumed a sharp upward track last week. Palm oil vaulted sharply higher rose to a near four-year high—with soybean oil following— on surveys showing a steep decline in October stockpiles and production.
Support came from a variety of areas: coronavirus-induced curbs in key growing regions; heavy rains that threaten to interrupt harvest; and, MPOB production estimates at the lower end of private expectations.
The La Nina weather pattern is expected to bring high rainfall in top producers Indonesia and Malaysia in the coming months, Refinitiv Commodities Research said, potentially disrupting harvesting, particularly if flooding ensues.
Historically Malaysia has seen a rise in its palm oil stockpile in October. But this year Malaysia’s October palm oil inventories likely slumped to a three-year low, with rainy weather and coronavirus restrictions seen hitting production while exports are expected to rise due to higher demand from India during a festival season.
The palm oil stockpile in the world’s second-largest producer is expected to have fallen 9.8% month-on-month in October to 1.56 million tonnes – its lowest since June 2017 – after a marginal rise in the past two months, according to a median estimate of eight planters, traders and analysts polled by Reuters. Production likely fell 5.6% to hit a five-month low of 1.77 million tonnes.
Stock levels would likely tighten further in November and December as plantations enter the lower output season and Northeast monsoon period, said Marcello Cultrera, institutional sales manager at Phillip Futures in Kuala Lumpur. “The market is moving higher on lower production estimate and lower end-stock from all polls, and stronger Dalian and soyoil prices,” a Kuala Lumpur-based trader said. Supply will be tight in the next few months, he added.
Paramalingam Supramaniam, director at Selangor-based brokerage Pelindung Bestari Sdn says “This bullish scenario in palm will continue unabated at least until the first quarter of 2021,”
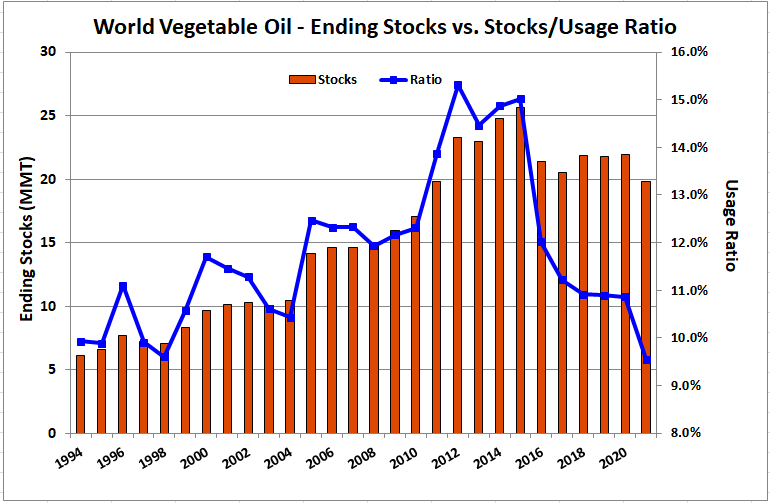
Palm oil charts below show the usage ratio for palm oil is hovering at a low going back to the late 1990s while world palm production tripled during that same time.
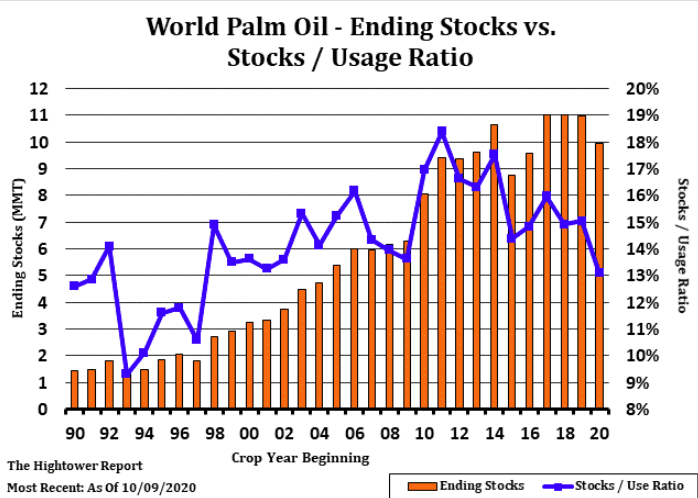
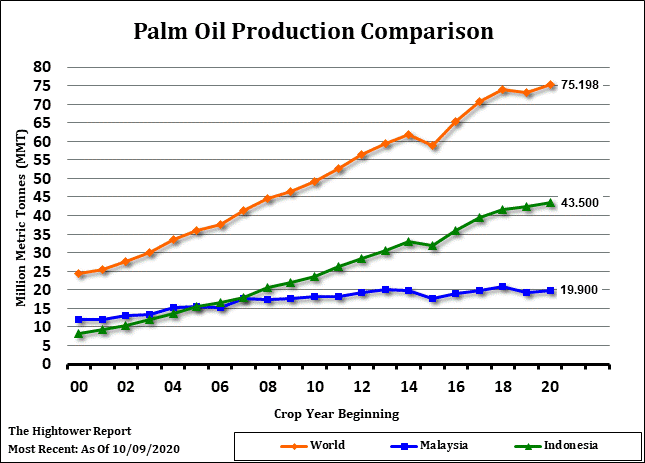
Oil prices are further supported by Indonesia’s announcement that plans to raise the bio-content of its palm oil-based biodiesel to 40% – known as B40 – is back on schedule with a target for implementation by July 2021, which will reduce exportable supply.
The world soybean scenario is also one of tightening supply amidst solid US export demand, a tightening US balance sheet, Brazil out of beans and weather in parts of Brazil and Argentina taking a more bullish turn.
As the U.S. soybean export pace proceeds at a record level, it is very possible that WASDE will be forced to raise U.S. soy exports and hence lower ending stocks to tighten up the balance sheet even more. Some analysts see the U.S. soybean carryout approaching the 150 mb level from the current 290 mb ending stocks (chart below). That is down from over 1 billion bushels slightly over one year ago. It would be the lowest ending stocks since 2013 when soybean futures highs ranged from $16.00 to $18.00 and soybean oil futures rose above 50 cents.
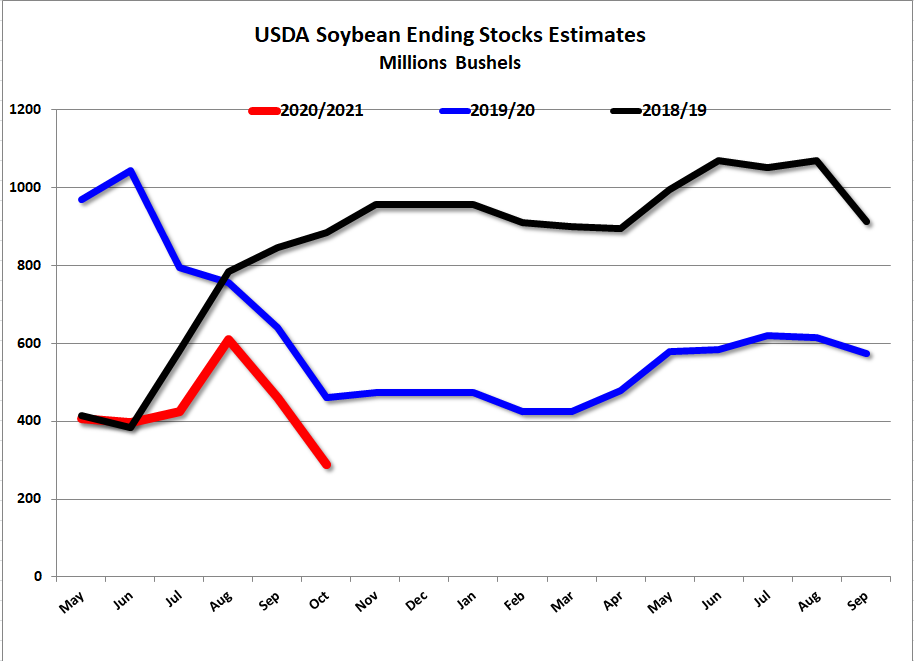
Total soybean exports commitments (the grand total of outstanding sales plus accumulated exports) are now 132% higher than a year ago due in large part to China’s strong return to the U.S. soybean market in recent months.
A major factor in China’s strong presence in the US market is that Brazil is, for practical purposes, out of beans. Brazil soy stocks as of Oct. 1 were the smallest in over 20 years and Brazilian farmers had already sold 55% to 60% of anticipated 2020-21 production. Reinforcing the idea of critically low Brazil soybean soybean stocks is an anecdotal report from cash traders saying a Handymax vessel was loading U.S. soybeans with a destination of Brazil in what would be the largest shipment to the country since 1997.
Any significant reduction soybean supply/stocks will reduce potential soyoil supply in the context of tightening palm oil and sunoil supply and stocks.
Market demand for soybean oil has stayed robust, particularly in its consumption for US biodiesel. For both the 2019/20 and 2020/21 marketing years, higher use of soybean oil for biodiesel is forecast. Stocks of soybean oil have tightened progressively over the past several months. Meanwhile, the USDA pegged U.S. soybean stocks at a five-year low, smaller than previously forecast, as adverse weather reduced the acreage that farmers will harvest.
Adding to the bullish world vegetable oil story is the fact that sunflower oil has made a sharp move higher on tightening Black Sea supplies—also due to abnormally dry weather.
USDA dropped global sunflower seed production for 2020/21 another 2.5 million tons from last month to 51.5 million and from 55 million in 2019/20. Drought-related yield reductions in the Black Sea region and area reduction for Argentina are mostly responsible for the change.
In Ukraine, sunflower seed output is seen 2 million tons lower this month to 15 million tons as yields suffered from the country’s driest summer in 30 years.
Planting of Argentine sunflower seed for 2020/21 has been stalled by a lack of rainfall in the northern part of the country. Argentine new-crop production was scaled back by 400,000 tons. The supply reduction is expected to tighten the level of season-ending stocks.
EU sunflower seed production for 2020/21 is forecast to contract by 250,000 tons this month to 9.5 million based on yield reductions for Romania and Bulgaria. Despite a favorable start for the crop last spring, eastern parts of both countries have been excessively hot and dry since July.
Given the location of the crop losses, international trade in sunflower seed oil may bear much of the impact. A sharp increase since summer in export quotes for Ukrainian sunflower seed oil already reflects the tighter global market situation.
The latest Grain Stocks report indicates that September 1 US sunflower seed stocks down by 26 percent from a year earlier. Even so, overall supplies are considerably larger with a sharply higher crop. NASS reports sunflower seed production at a 44-percent increase from 2019/20 and the highest production since 2015/16.
North American 2020/21 canola production is faring better, but as explained at the beginning, fungibility forces canola prices to trend with other edible oils. Canadian canola yields are projected to increase but production to decrease as a result of lower harvested area. Nationally, canola production is expected to decline only 0.4%. U.S. canola production for 2020/21 is forecast down by 214 million pounds from last year to 3.187 billion pounds. Total supplies of canola for 2020/21 are expected to change minimally, however, as higher beginning stocks and imports counter the smaller harvest.
Wrapping up fundamentals:
- For the next ten days to two weeks, dryness and normal to above temperatures are expected in both Argentina and southern Brazil as La Nina strengthens.
- In addition to a La Nina threat to South America soybean production, La Nina is already reducing palm supplies with “excessive rains disrupting harvesting work… and reports of reduced workforce amidst COVID-19 (are) likely to have depressed output.”
- Border closures in Malaysia and a temporary order in key palm producing state Sabah for plantations to work at half capacity to help contain the coronavirus outbreak have led to a shortage of workers harvesting the perishable palm fruit.
- And foremost of all, the usage ratio for global edible oils is the lowest level since 1998 (chart below).
Technicals (Based on Rules & Statistical Indicators)
Technical analysis is arguably the most objective of all market analysis. As one well known trader once said, “Everything known is reflected in a price.” I.e., all news is accounted for in a price; the market reflects the collective opinion of all publicly known information
Objectivity is also implicit because technical analysis follows a set of rules. Relative probabilities determine a preferred interpretation. If a rule is violated, one knows immediately that the current technical interpretation is invalid. Invalidation most often does not change the larger trend outlook, but rather requires modification of some finer details of the interpretation, such as the maturity or completeness of a current wave.
By way of background uptrends (downtrends) are composed of five waves. Three of the waves, 1, 3 and 5 are “impulsive” waves to the upside (downside). Waves 2 and 4 are corrective and move in the opposite direction of the larger, main trend.
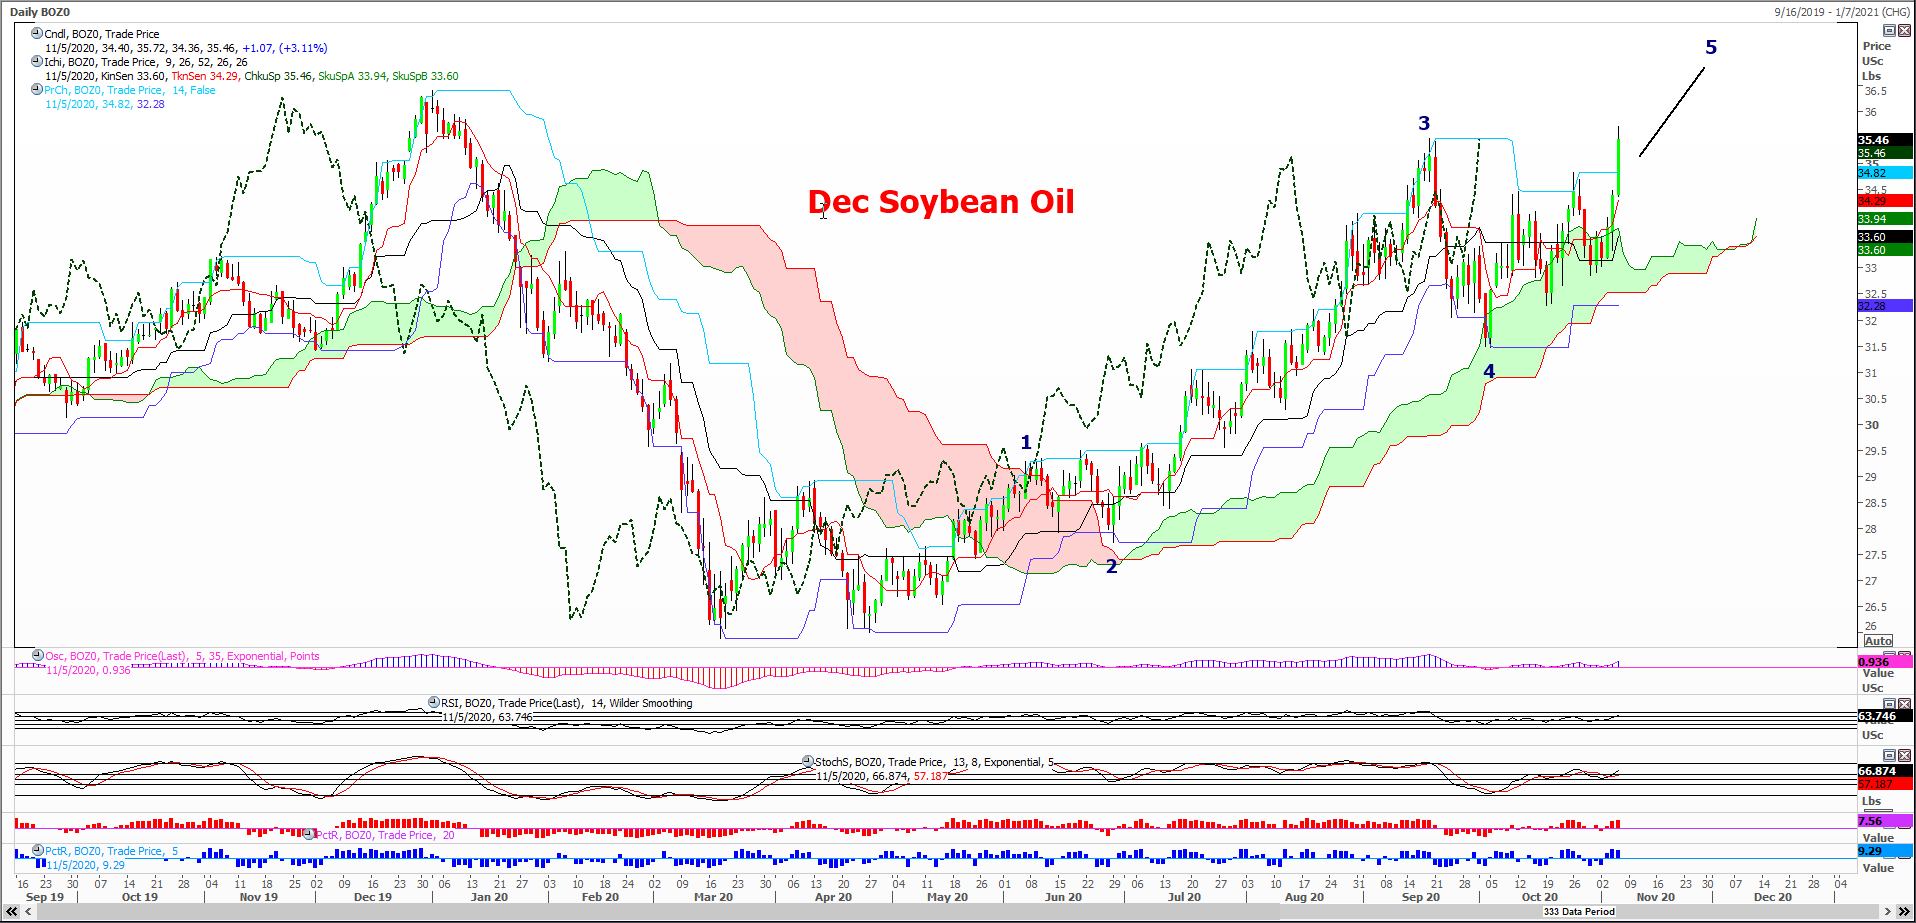
Of the charts below, our focus is on soybean oil futures because soybean oil has the most liquidity (volume) and participation of sophisticated large speculative traders whose trading decisions are based on technical indicators.
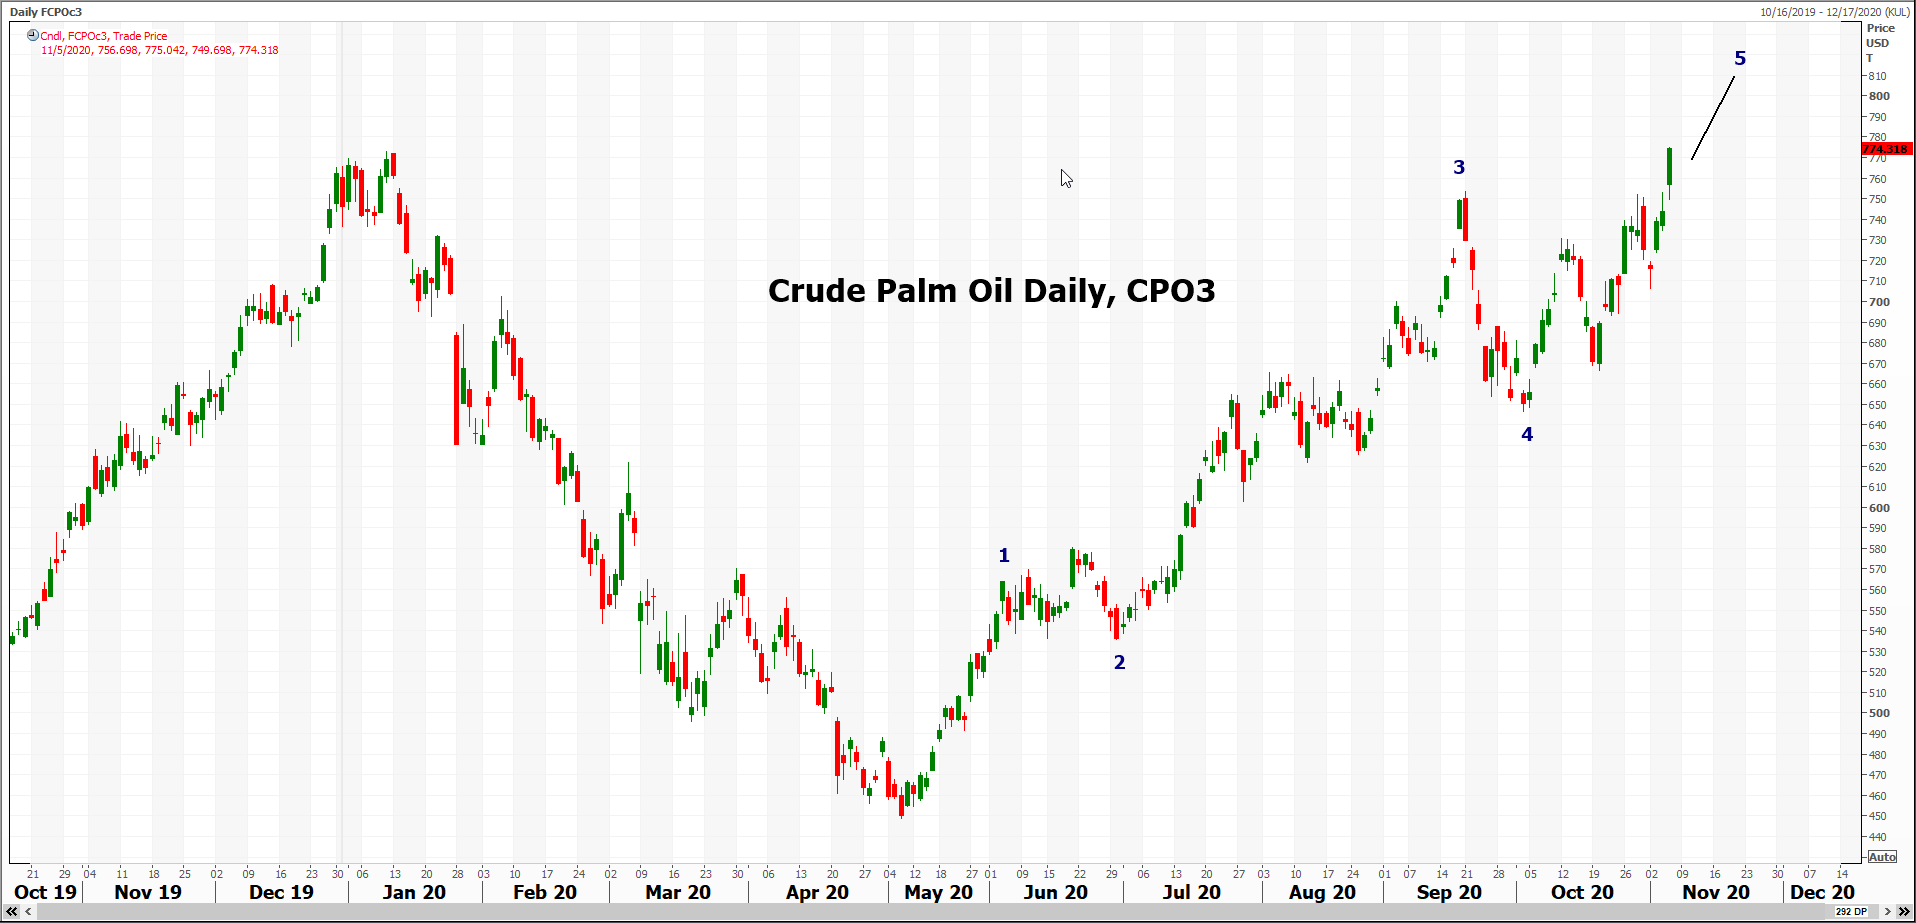
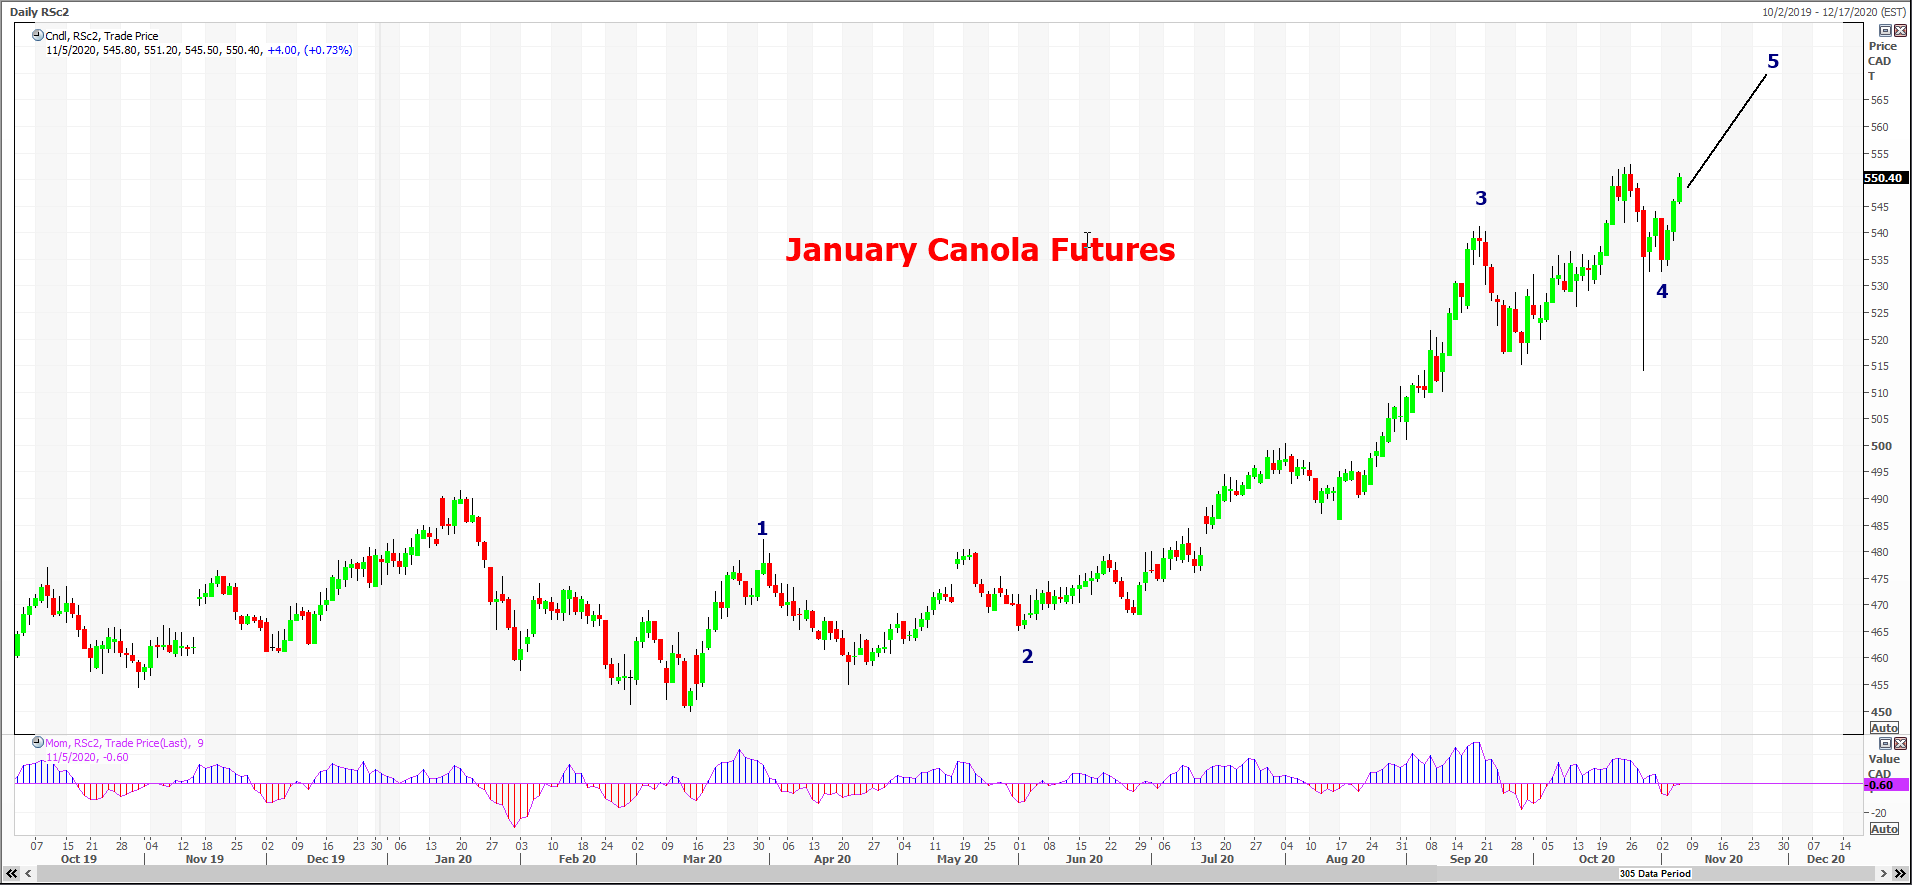
In each of the charts—SBO, palm and canola—one can see that the markets are bullish and that the current uptrend for each market has completed four wave and is currently in a final wave 5 to the upside. Once wave 5 is complete, it will be followed by a three-wave correction that will likely retrace up to 50% of the entire 5-wave gain.
As a risk manager this tells you that if you already have coverage out one or two quarters, the
market will likely give you opportunity to extend coverage during the corrective pullback.
