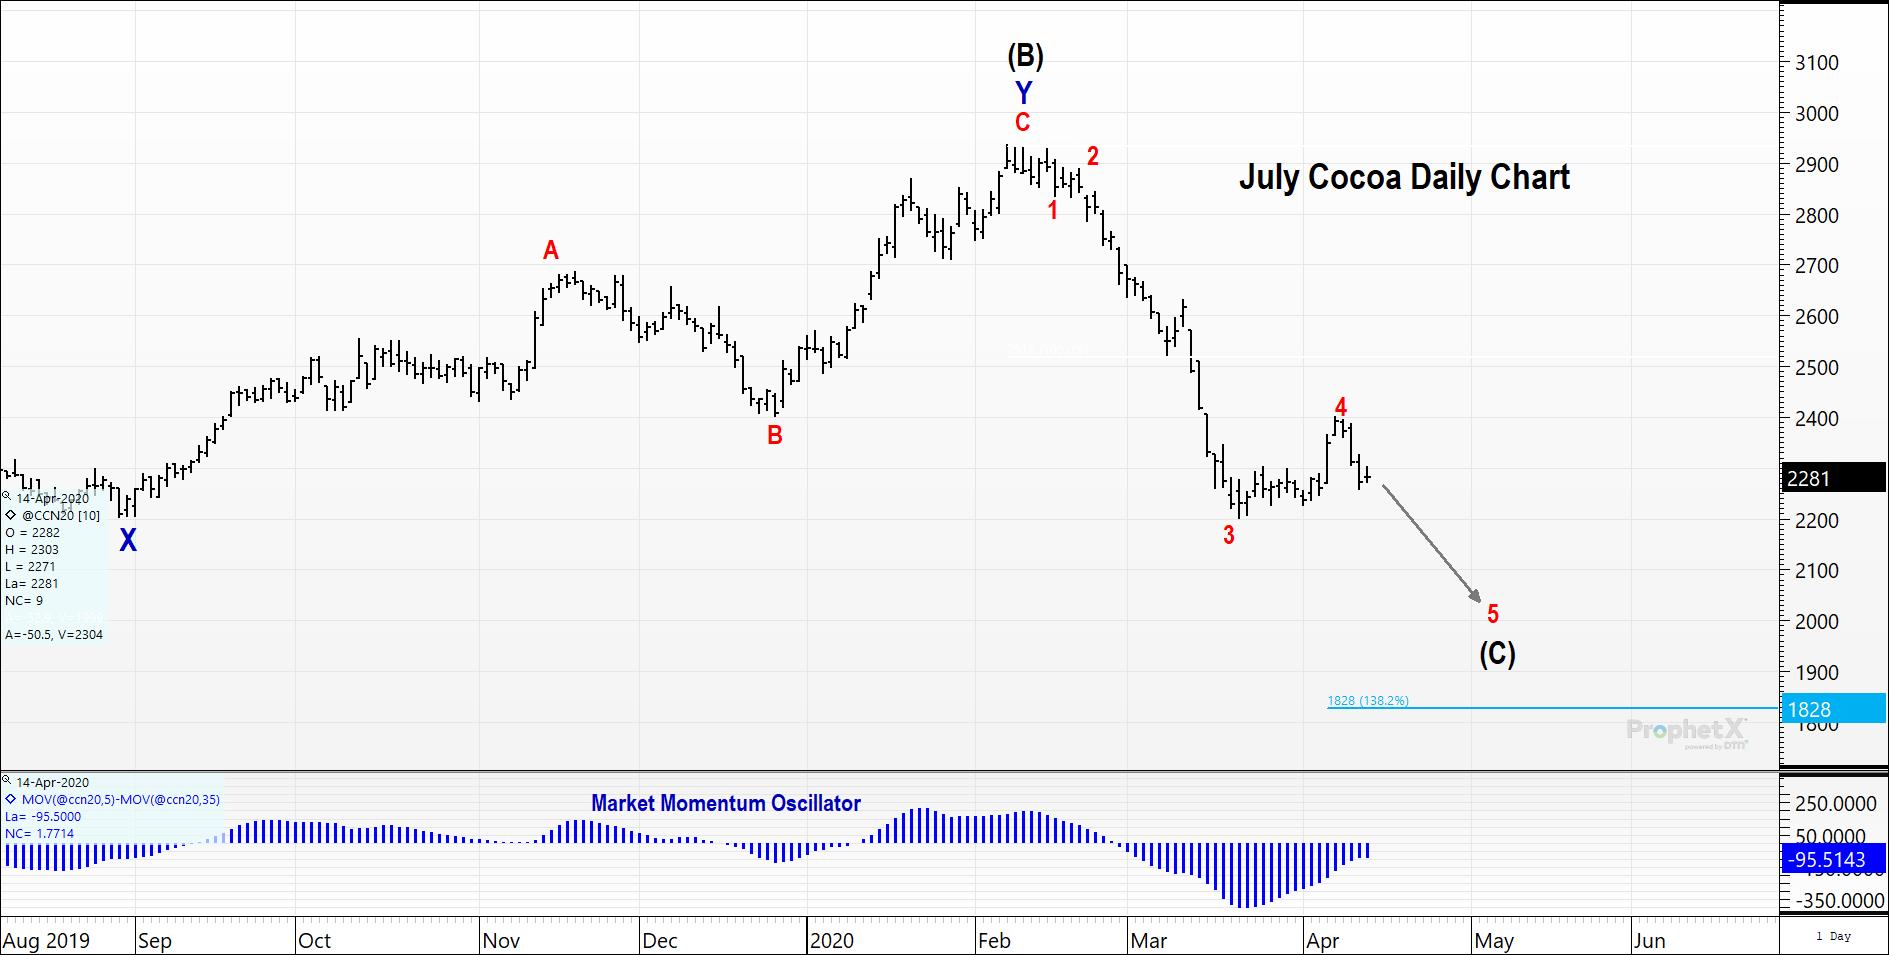
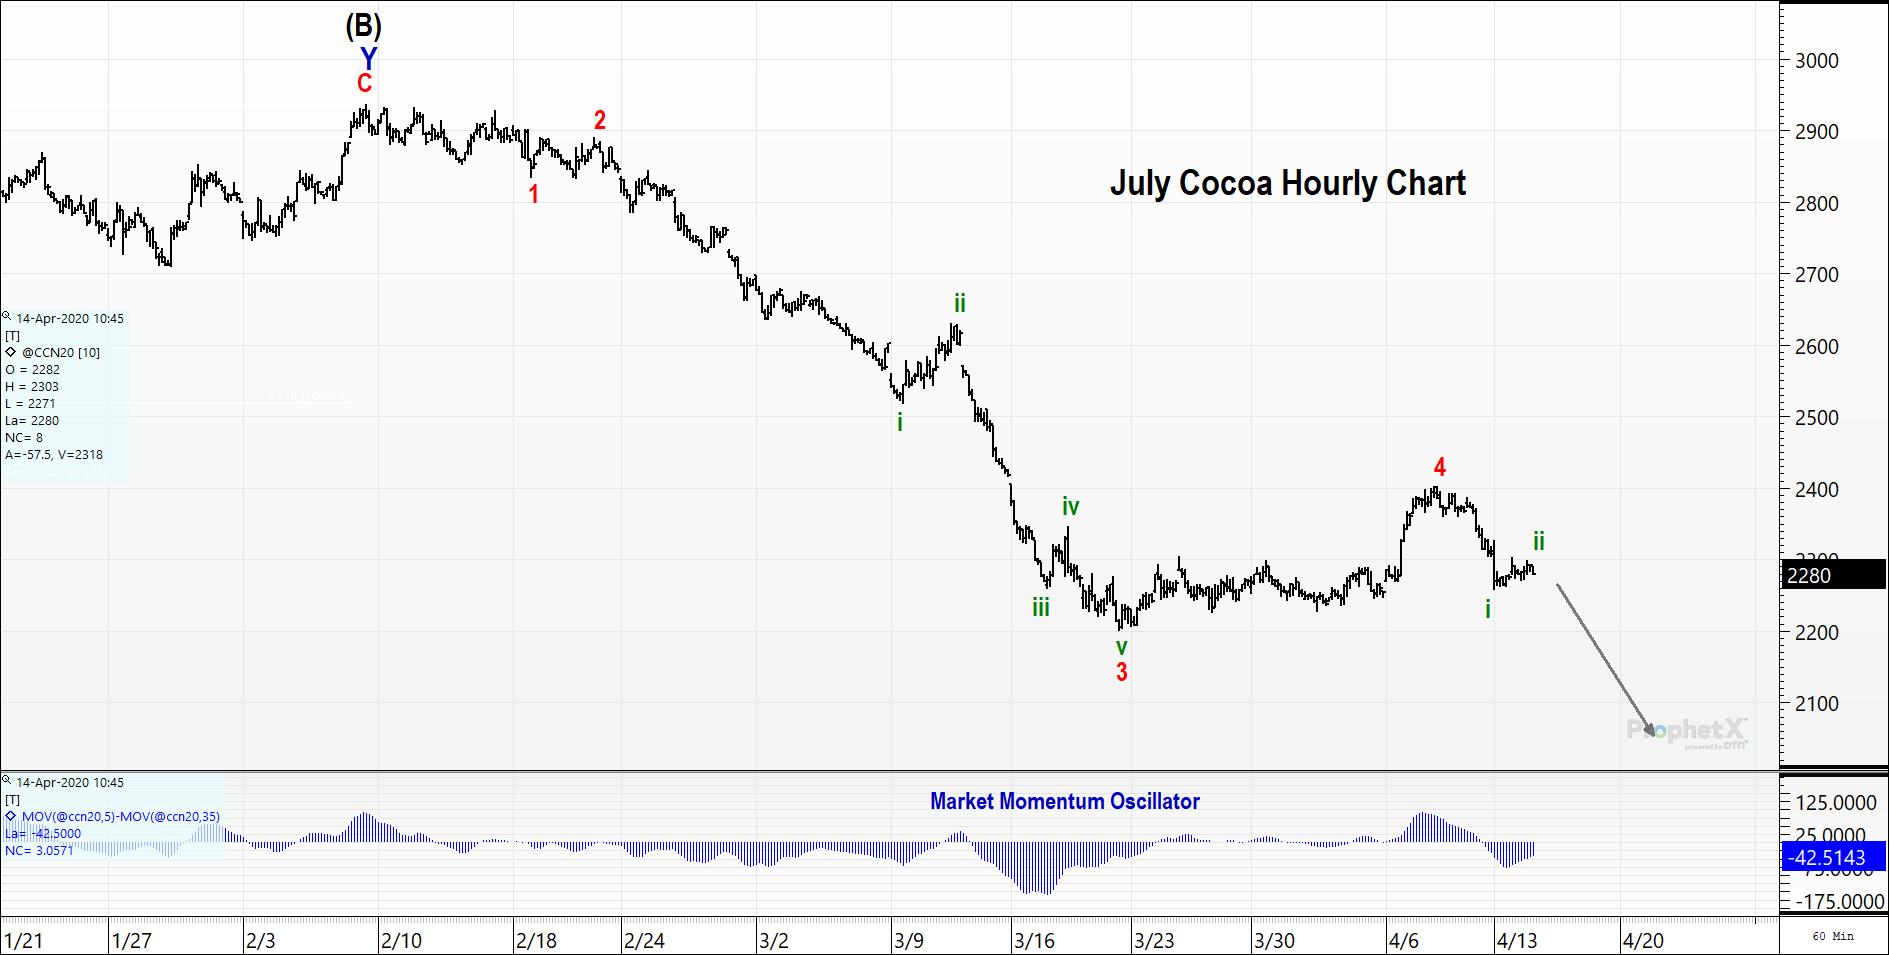
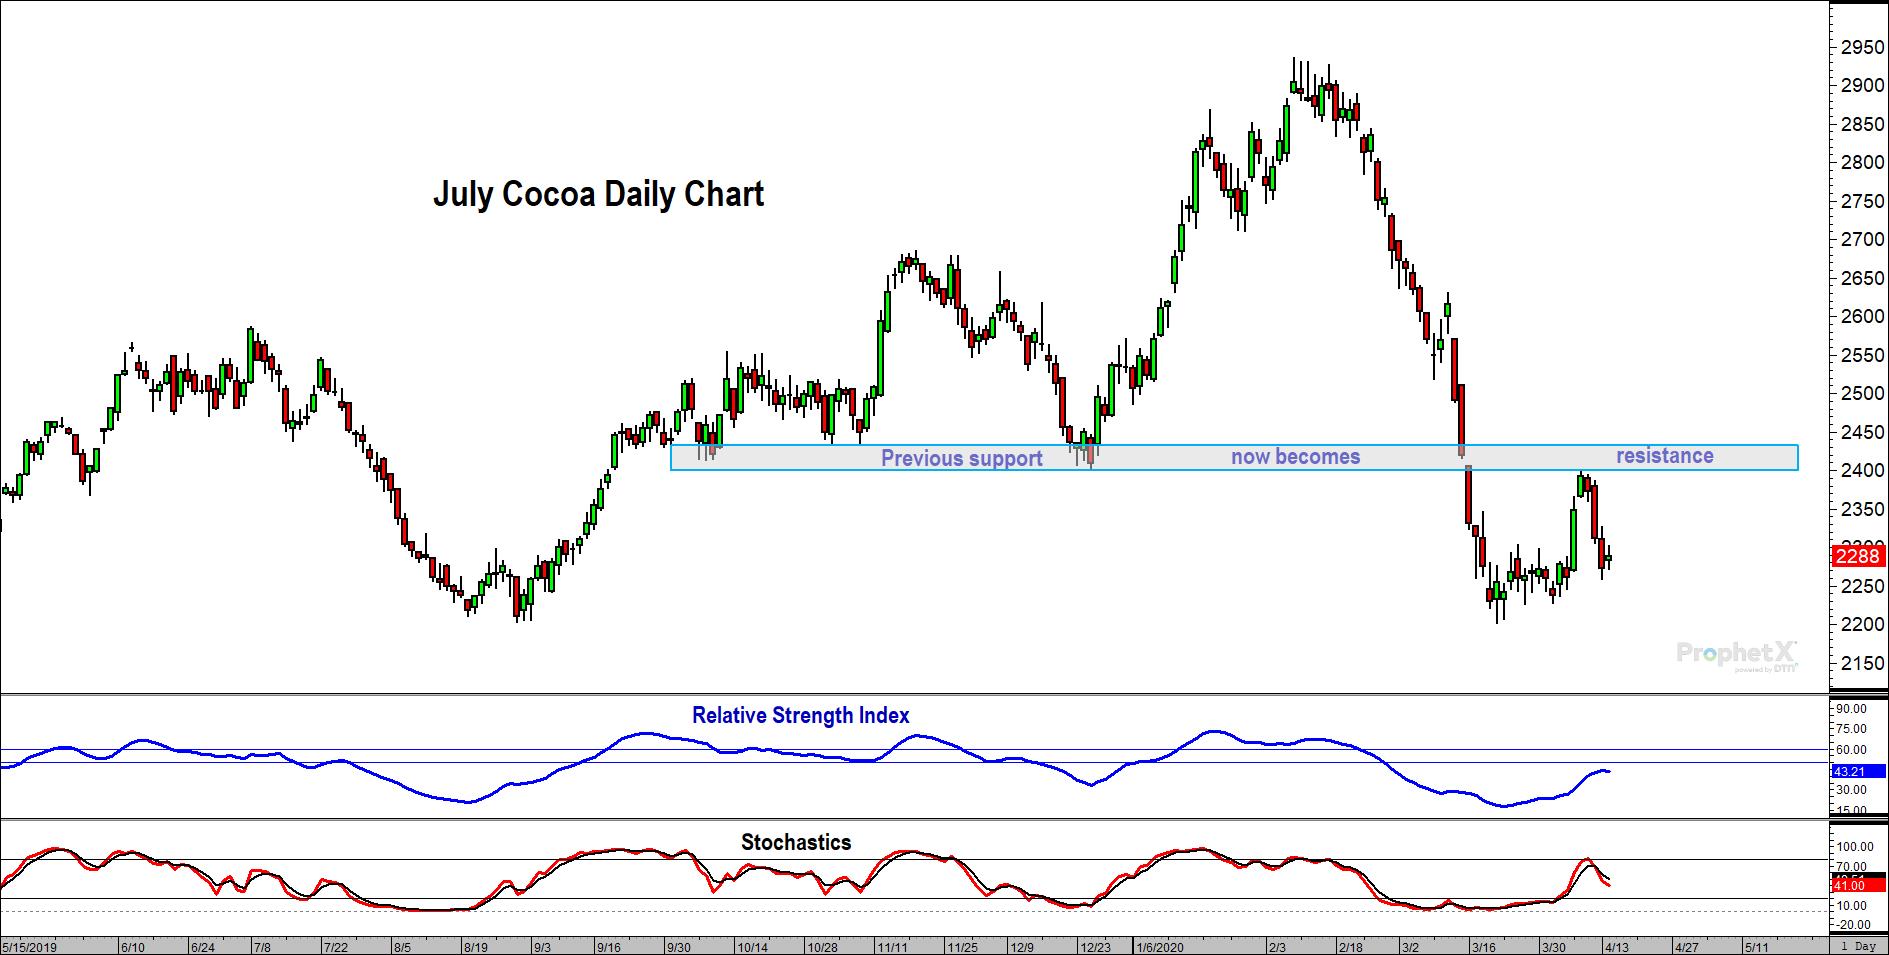
Cocoa has been experiencing a nice down trend since topping in July. And although it “appears cheap”, we feel that it is only relatively cheap and look for further downside ahead. Looking at the daily chart, you can seen a we are beginning wave 5 of (C). This wave should target the $2000 level. The hourly chart shows clear subdivisions adding confidence to the wave count. The third chart, showing RSI and Stochastic indicators, reveals a couple of key bits of information. First, you can see that in the most recent rally (3/23-4/10), RSI values came no where close to bear market resistance (50-60). This illustrates the overall long-term bear trend is still in tact. Stochastics touched the overbought area and immediately retreated, suggesting the bears are in control. Finally, you can see the previous support established during the uptrend late last year has now become resistance and will need to be penetrated before any doubt in the down trend. The previous swing high at 2402 (July) is the key resistance level that needs to maintain this forecast with confidence. Taking out the low of 2201 will bolster confidence that this wave interpretation and forecast will come to fruition.
From a buyer’s perspective, one can be patient unless prices establish themselves (two closing prices) above 2400. If prices make new lows accompanied by divergence in momentum, and 5 subwaves are clearly identifiable (waves i-v of 5 of (C)), then a buyer can feel confident and comfortable extending coverage through 2020 and beyond.


