Coffee Futures To Climb Higher
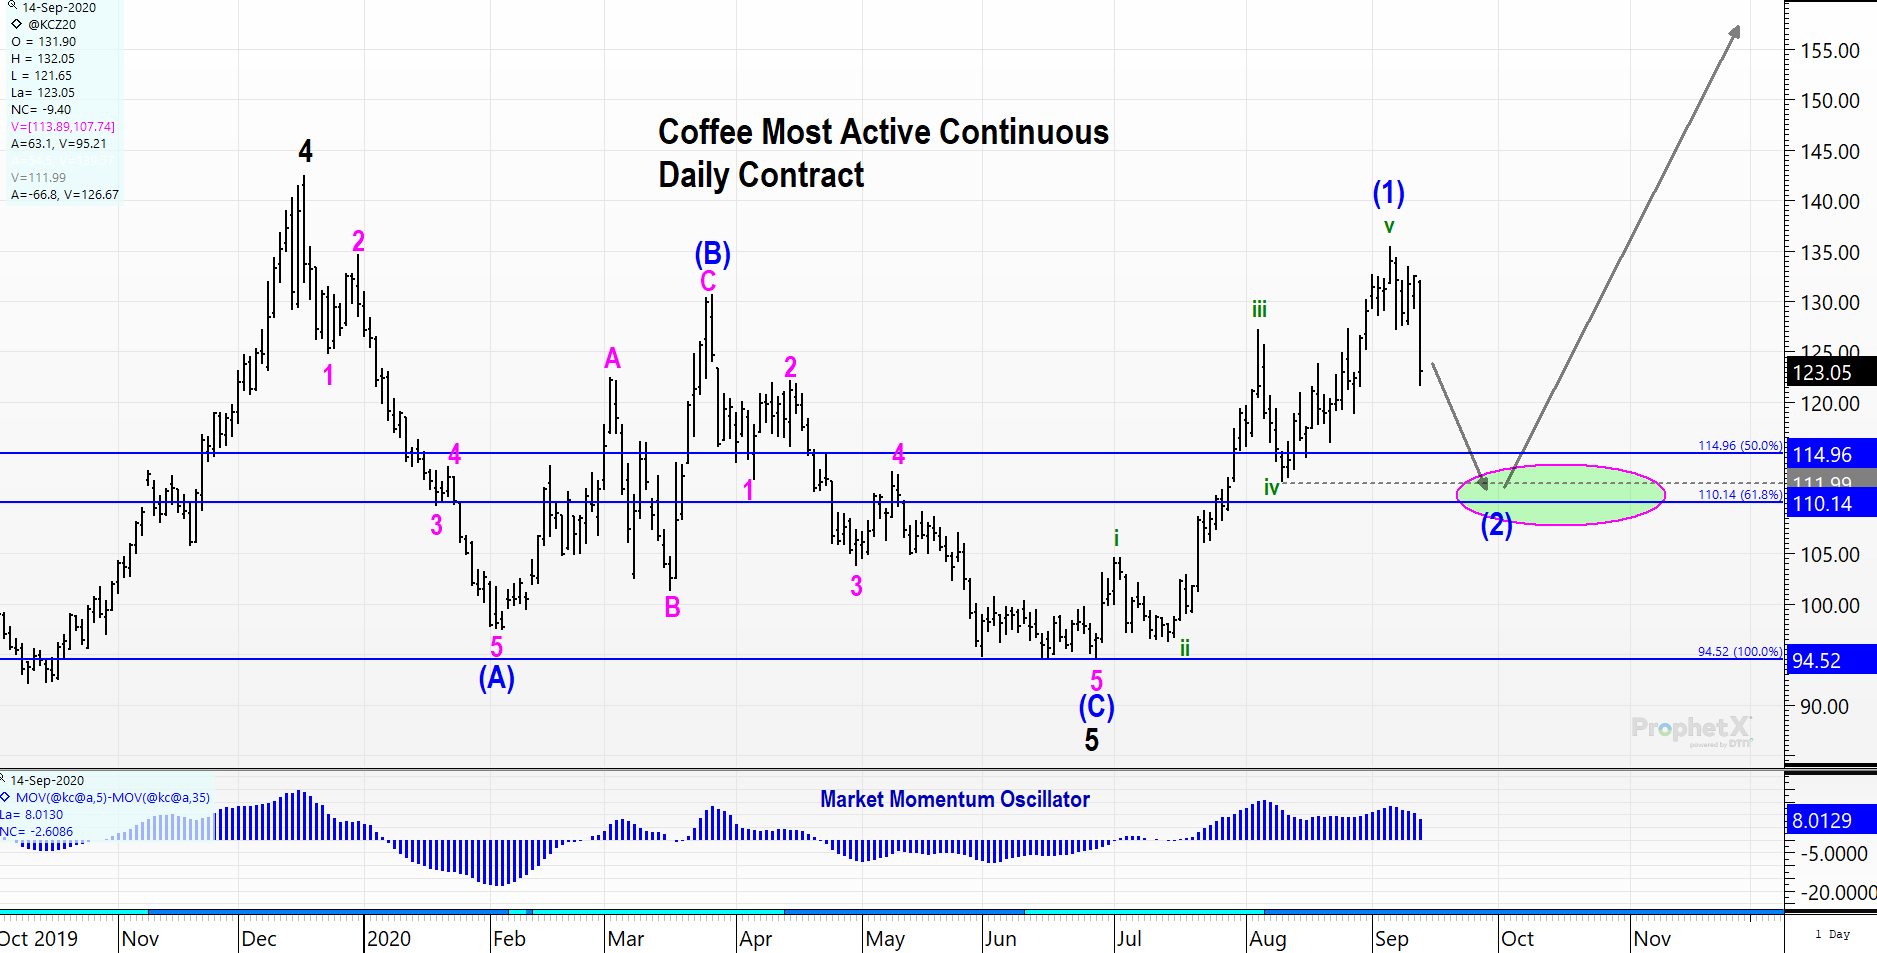
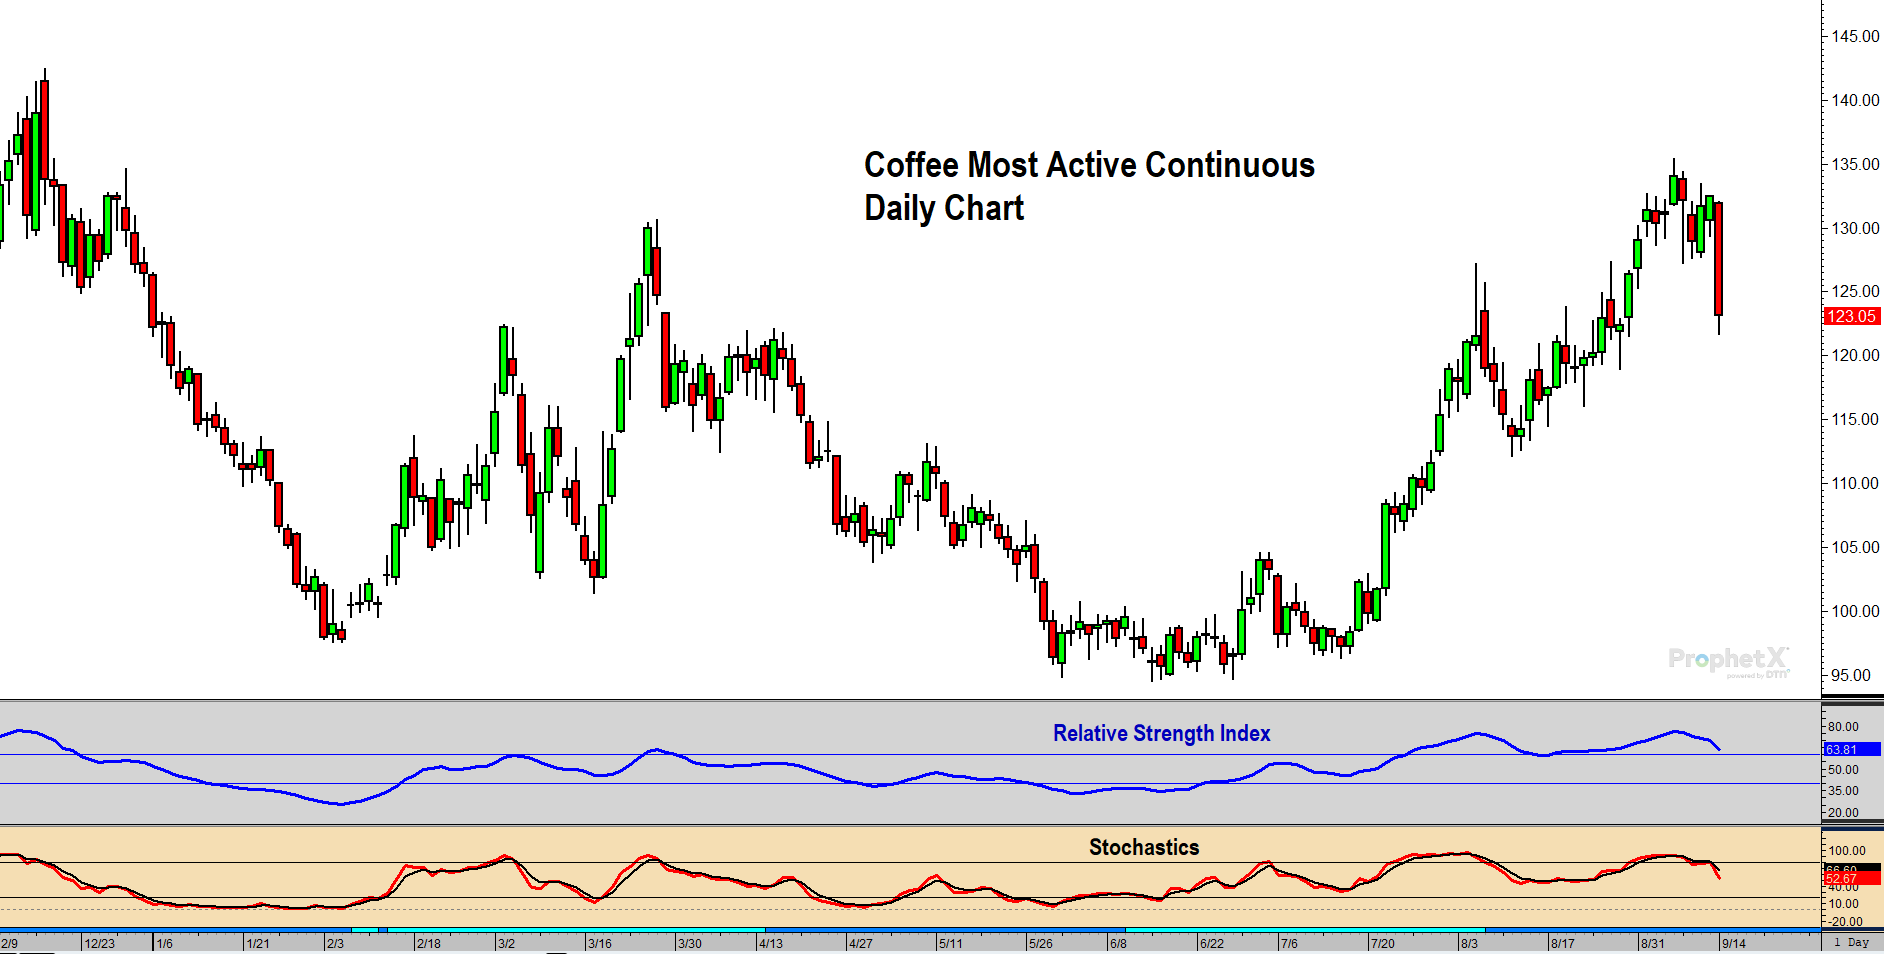
Today’s price action (speed and magnitude) in coffee suggests the previous 5-wave rally that began in late June is complete. Expectations now are for prices to zig-zag back to the 110-115 area in 3 waves (waves A, B, and C of (2)). This will provide an excellent purchasing opportunity because the initial 5-wave rally that occurred from June 26th until September 4th implies another new price high is coming in the market (above 135).
The Bottom Should Be In
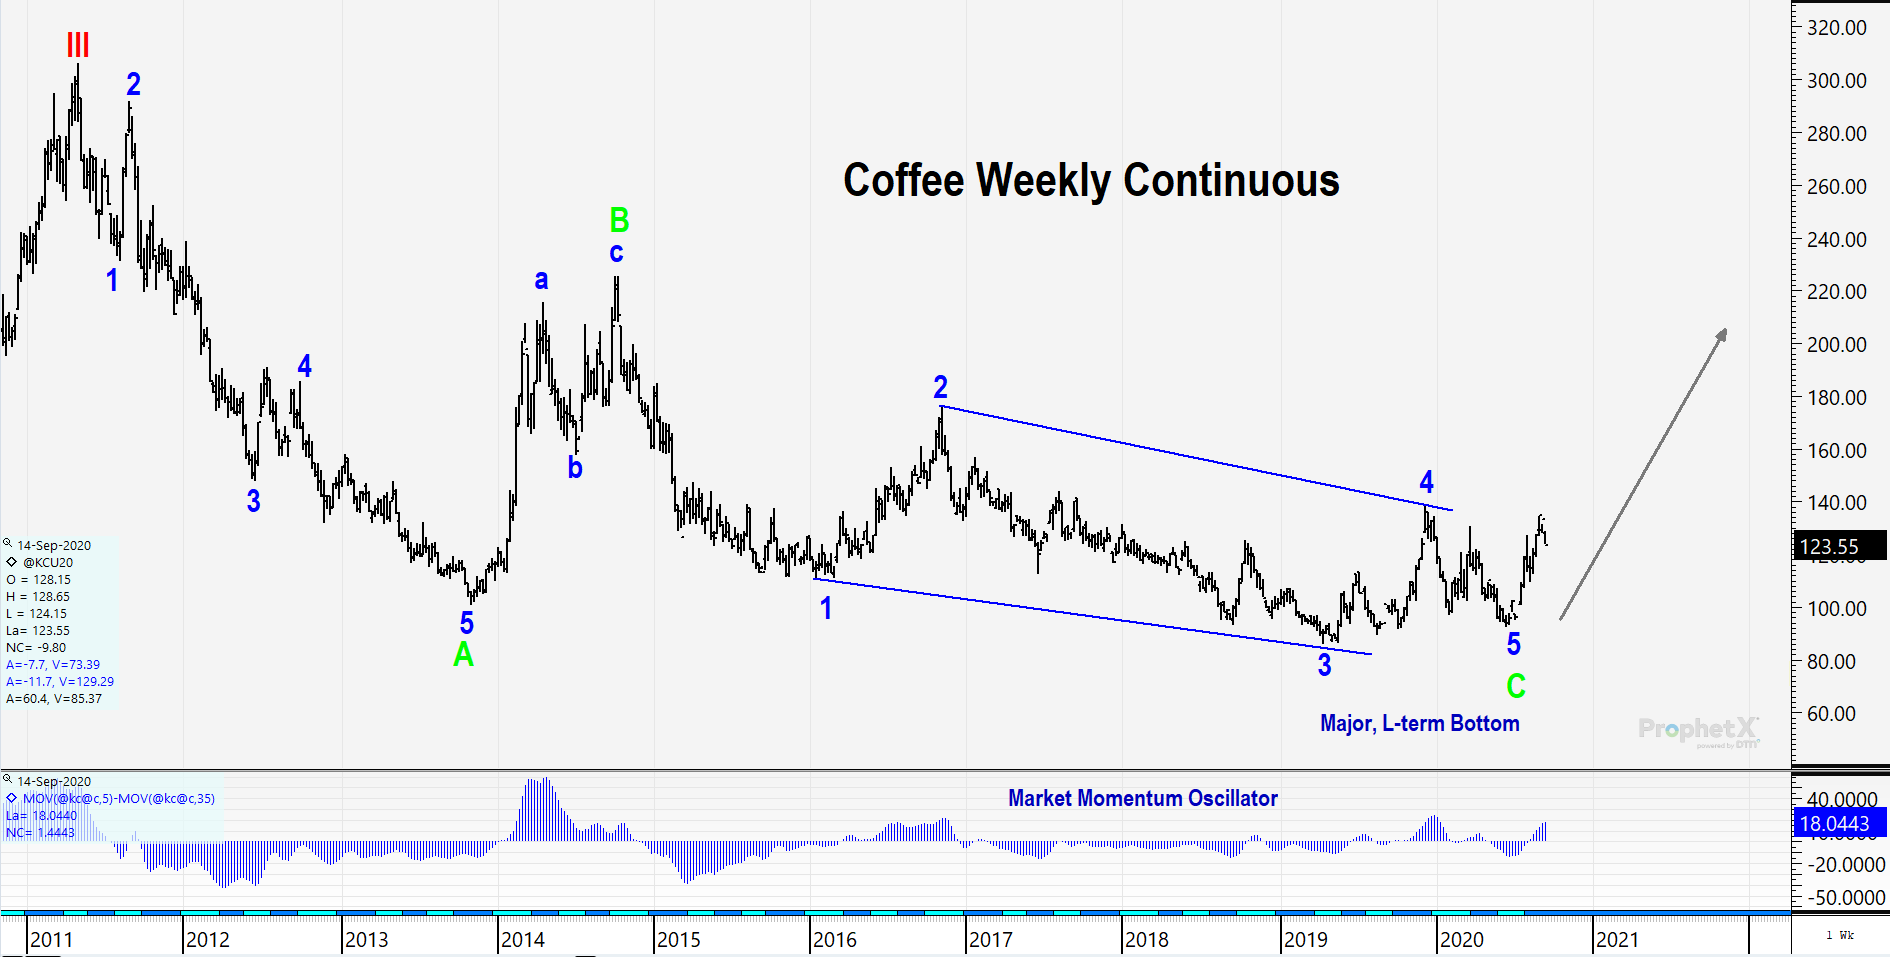
We believe the long-term bottom is in place; however, even if we were wrong, and the previous rally is part of a correction, we should still see a new price extreme to the upside(in a wave (C)). The price targets of 115 and 110 are the 50% and 62% Fibonacci retracement levels, respectively. Another level to watch that clusters is 112. This is the end of the previous wave 4 of one lesser degree. Together, these targets provide a zone that is a good place to get long.
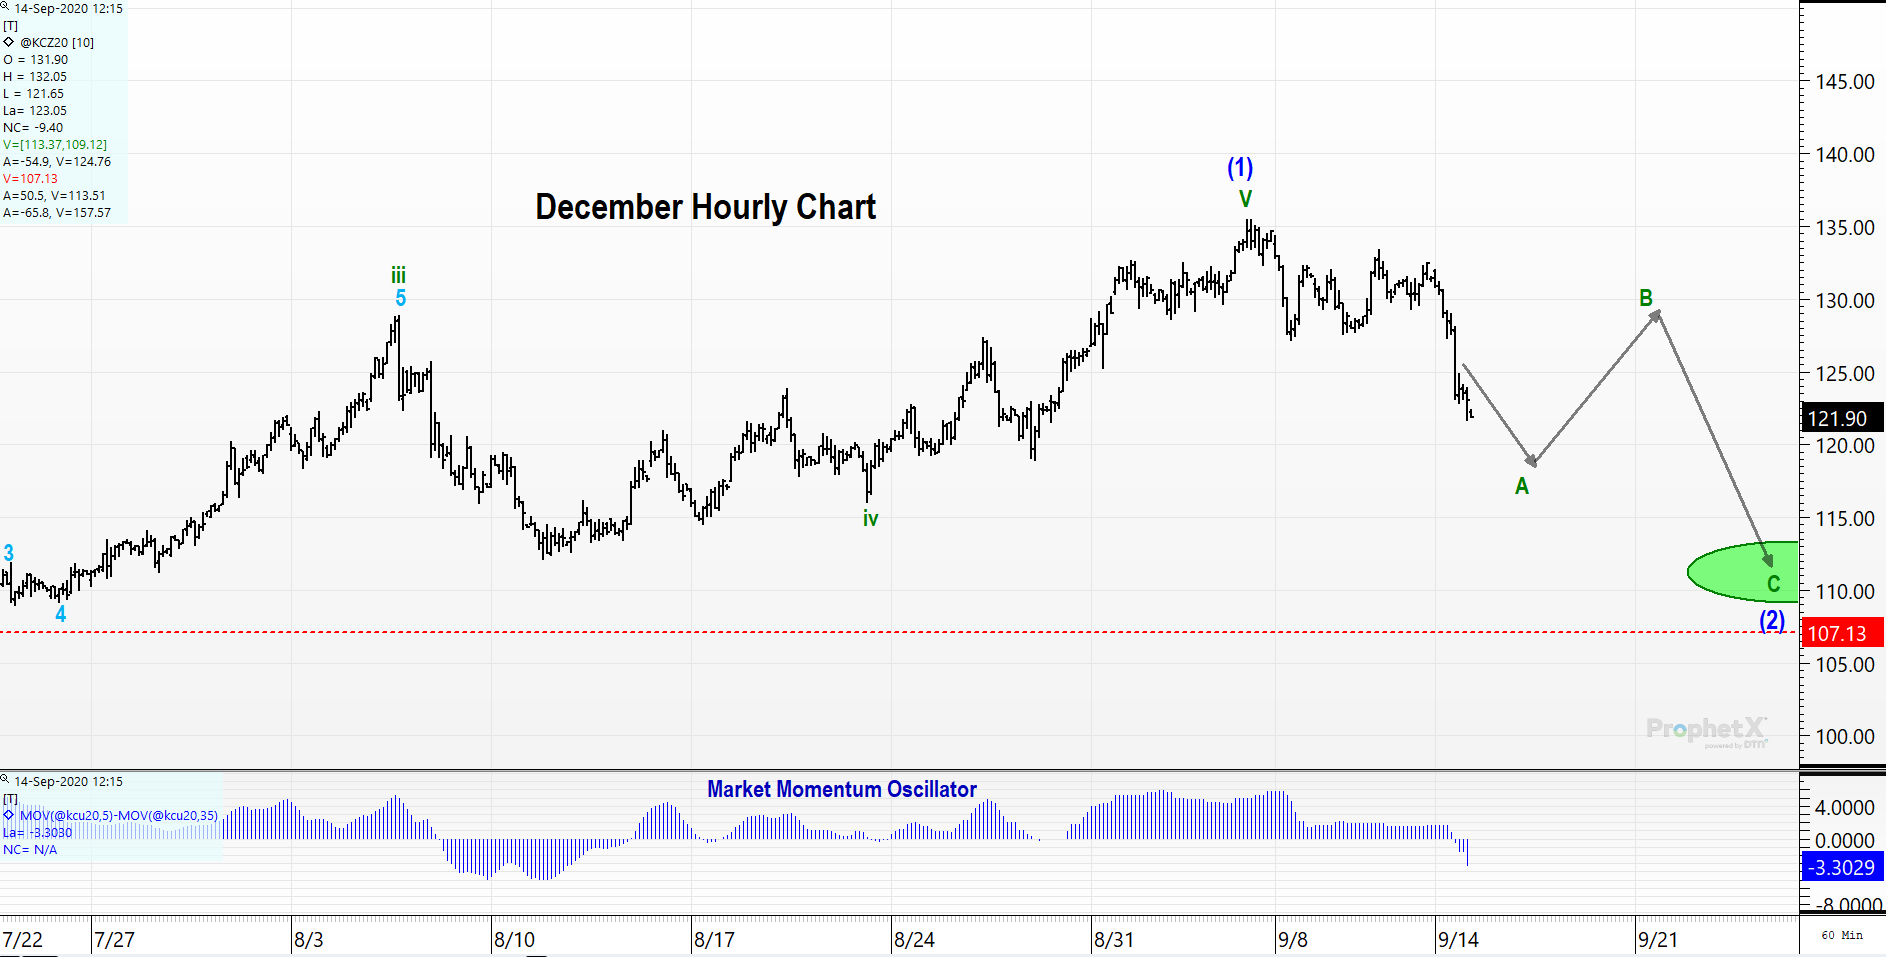
Getting a closer look on the hourly chart, you can see the expected zig-zag price action. If/when wave B is considered complete, a Fibonacci extension can be drawn to provide another price target for prices to bottom during this pullback. If that price target coincides with previously established retracement targets, confidence will build.
Combining The Wave Count With Common Technical Techniques
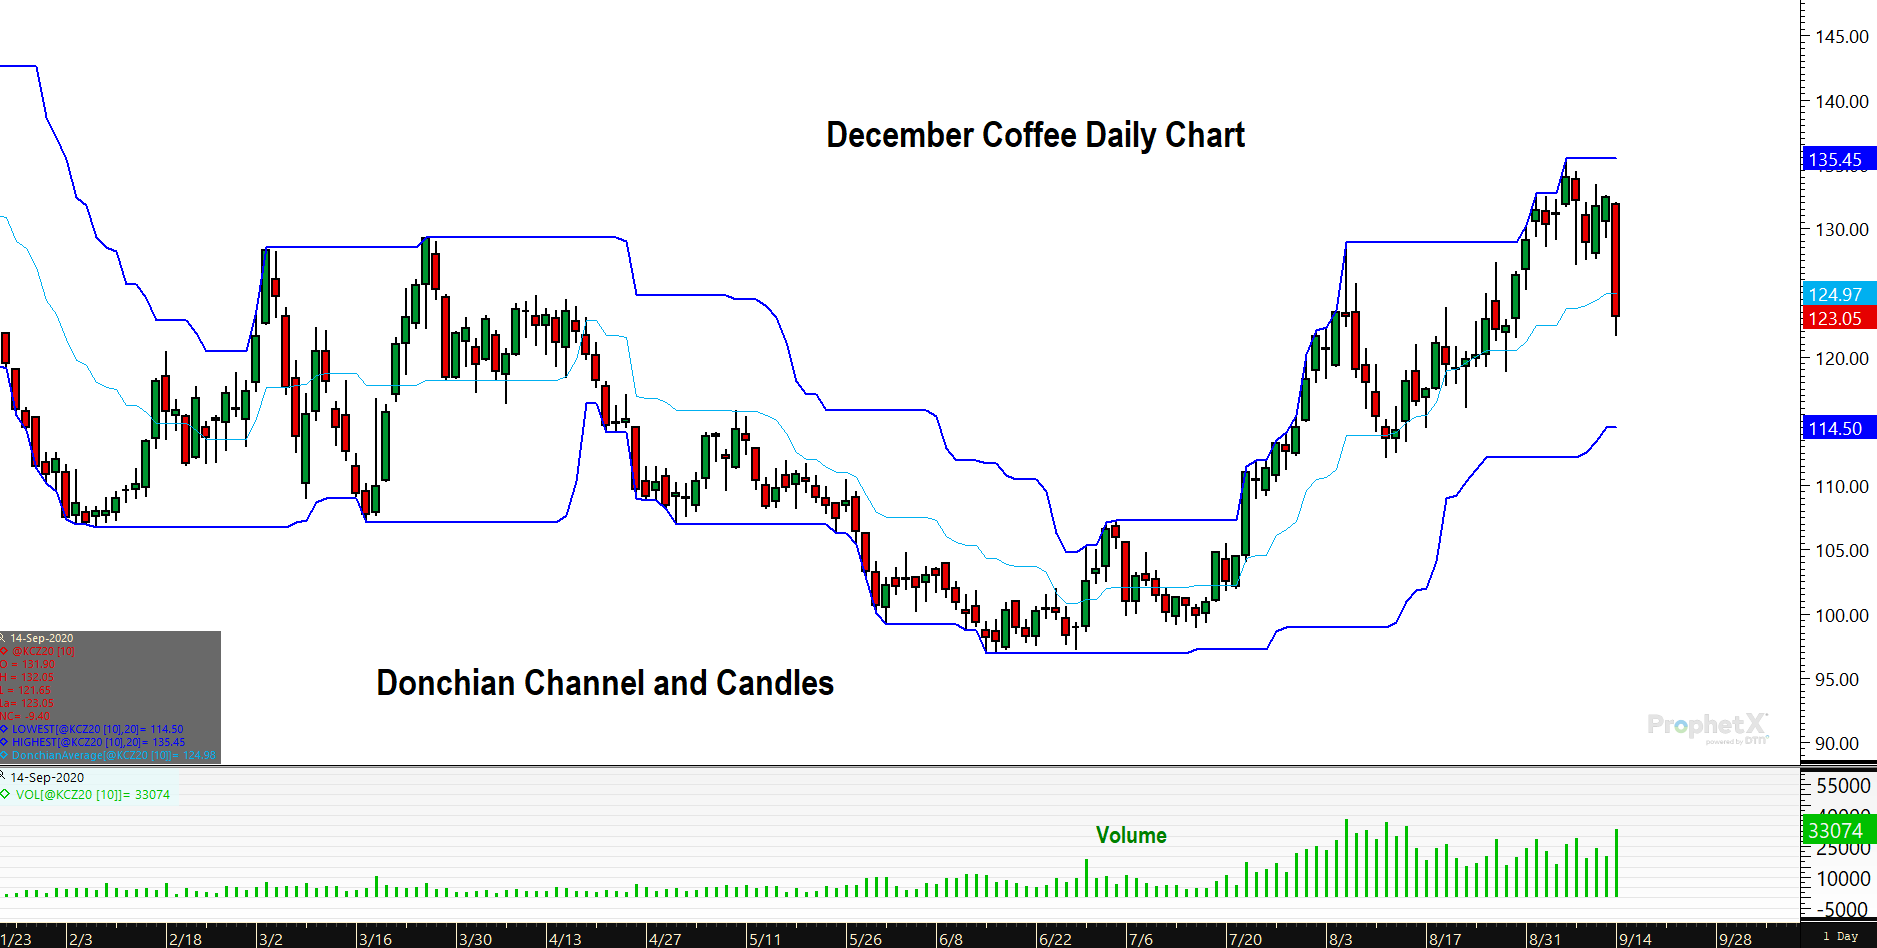
Prices have broken the midpoint of the Donchian Channel—a good first step for bears. Monday’s candle illustrates the bears were well in contol of price.
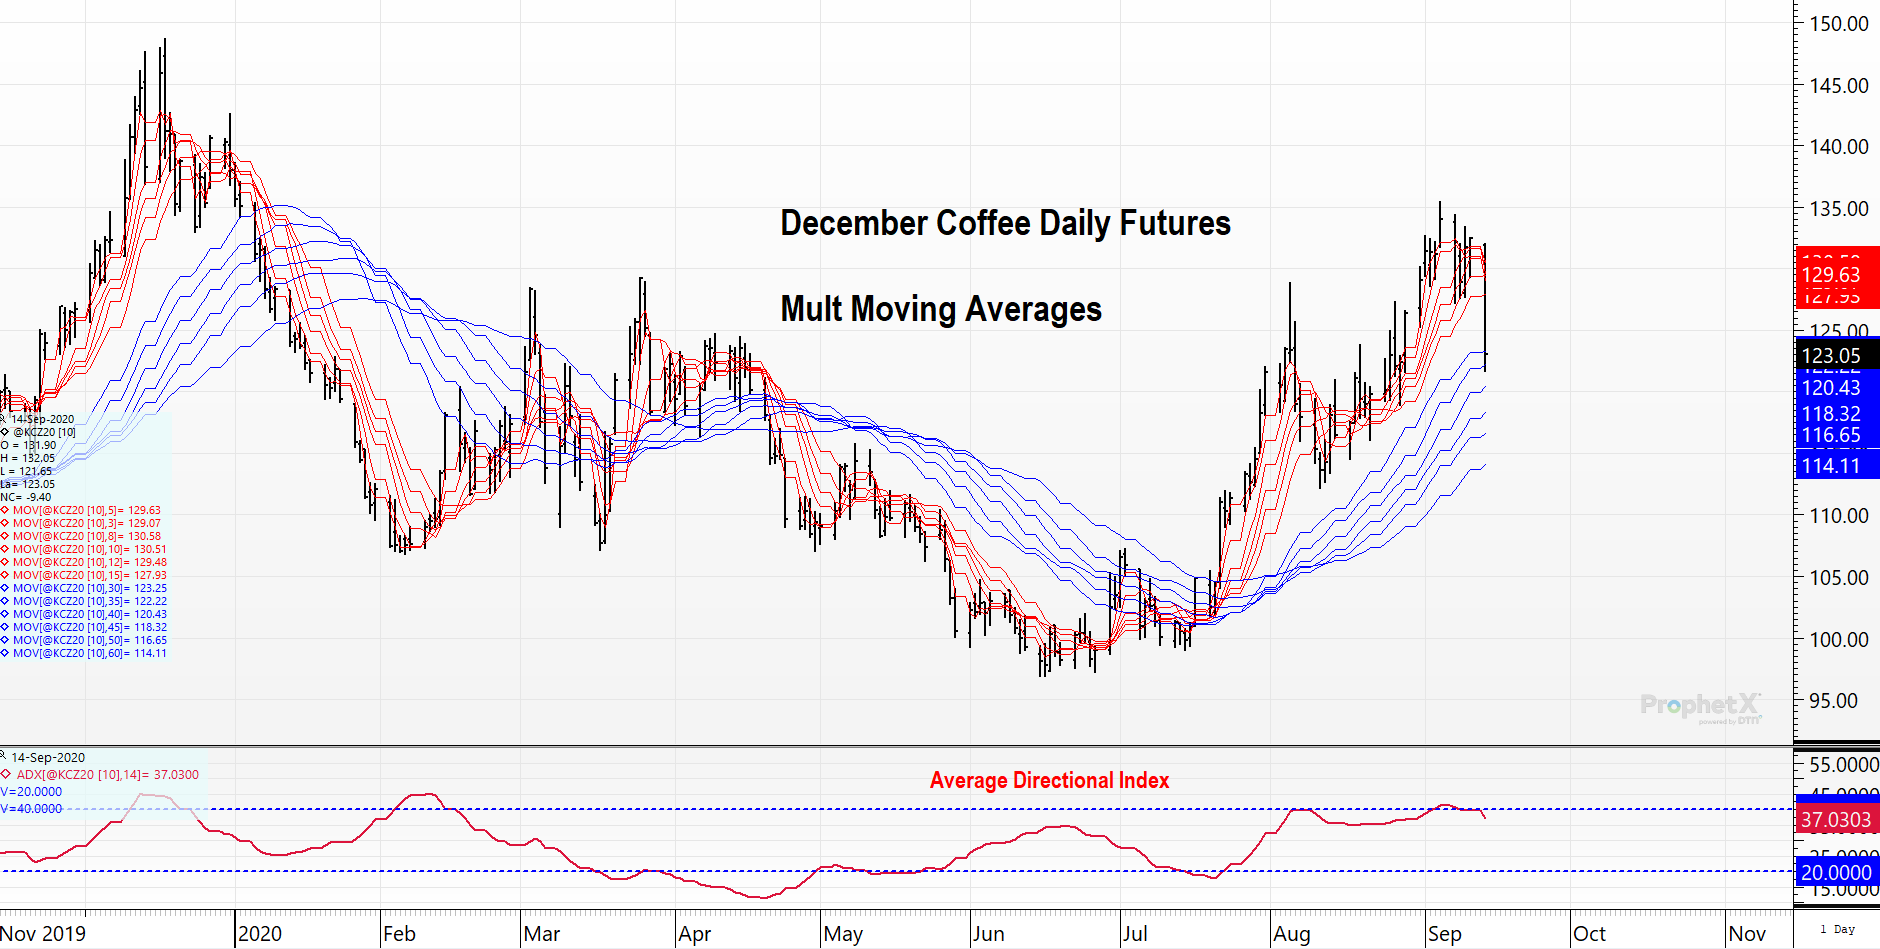
Looking at our multiple moving average chart, you can see the previous trend has stalled according to the ADX. Long-term moving averages are still sloped higher (bullish) and price declines that test an long-term, positive-sloped trendlines can be considered buying opportunities.
By conquering the 60-level back in late July and remaining higher, the RSI is indicating that the previous down trend is over (ending June 26th). Look for the the 40-level vicinity to hold as support as this wave (2) correction takes places. That will add confidence to adding long positions when some believe the downtrend is back in force.
Coffee Buyers’ Perspective
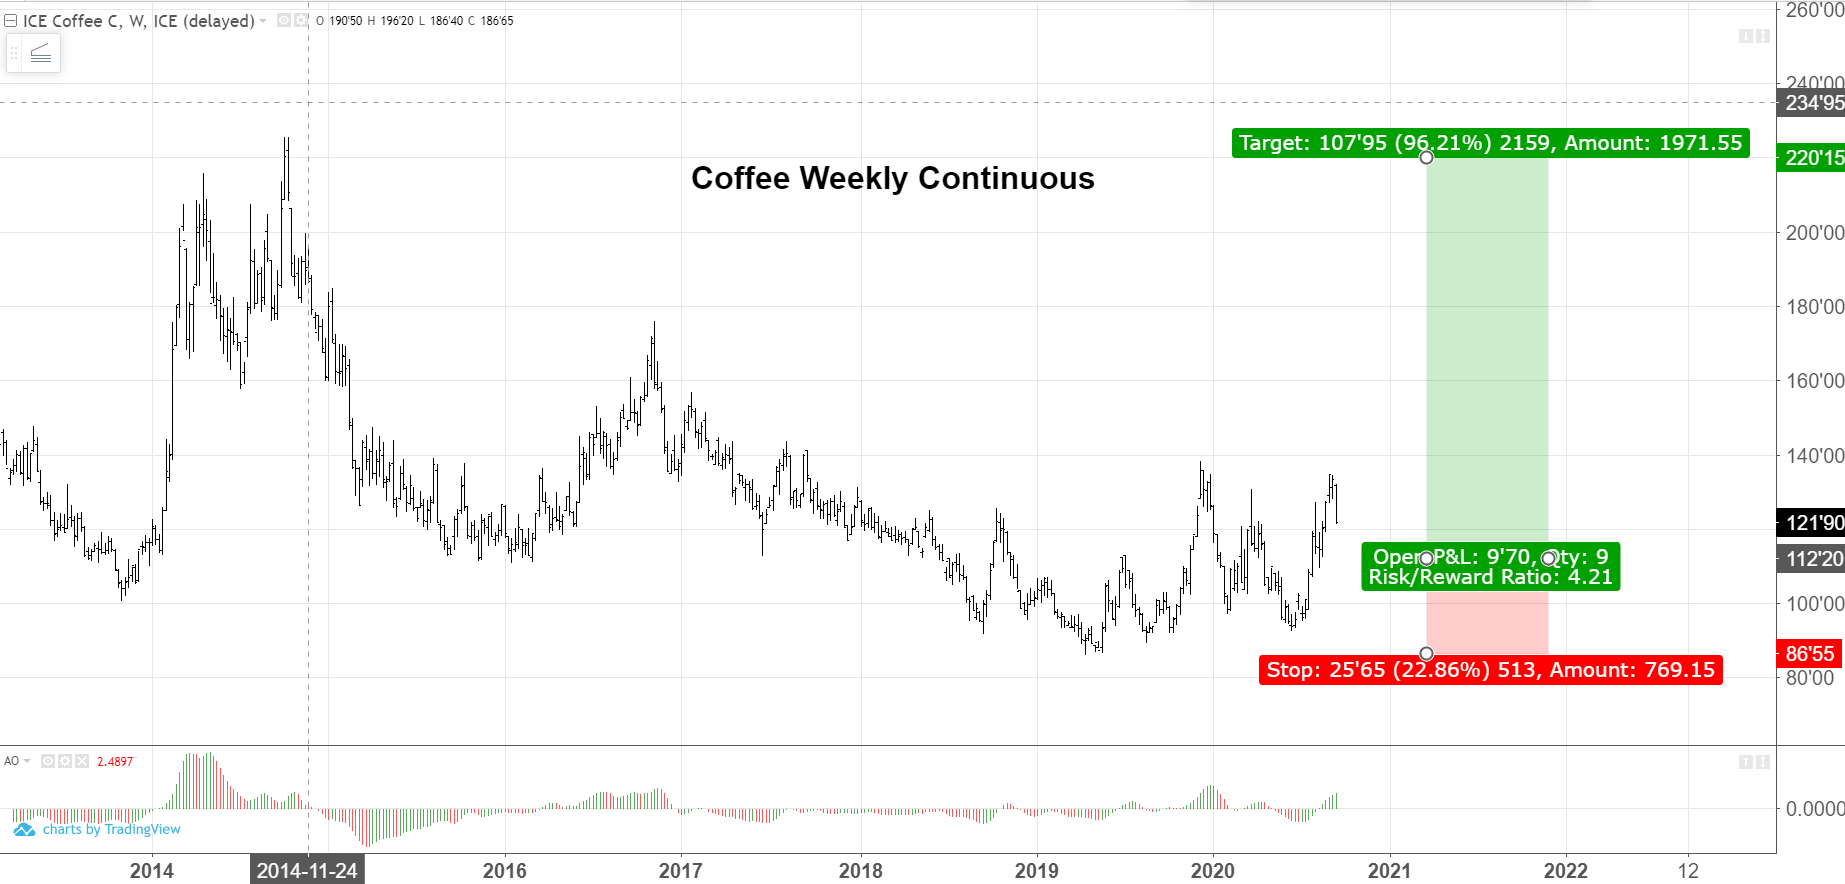
Taking the long-term view (weekly chart), our interpretation is the bottom is in place. If/when we get a price retracement to the 110-115 area, once can see the risk-reward is excellent (see chart below) in extending long purchases. Because the wave C of the previous decline was an ending diagonal, one cannot be surprised if prices are double their value in 2022.
