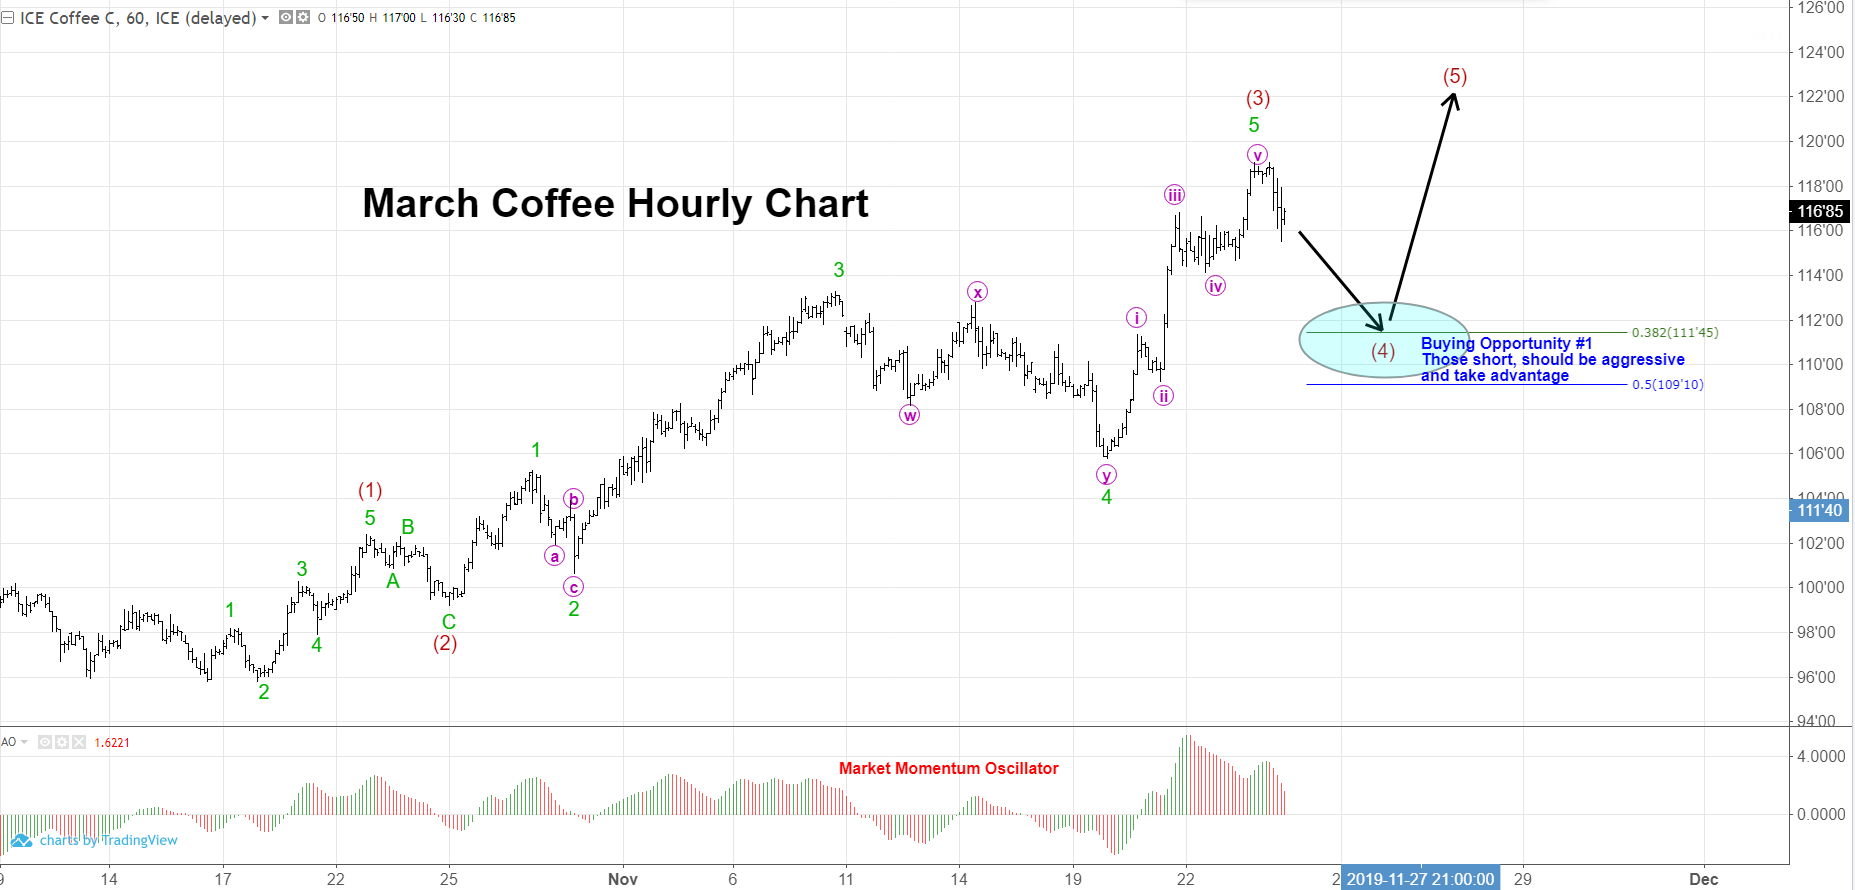
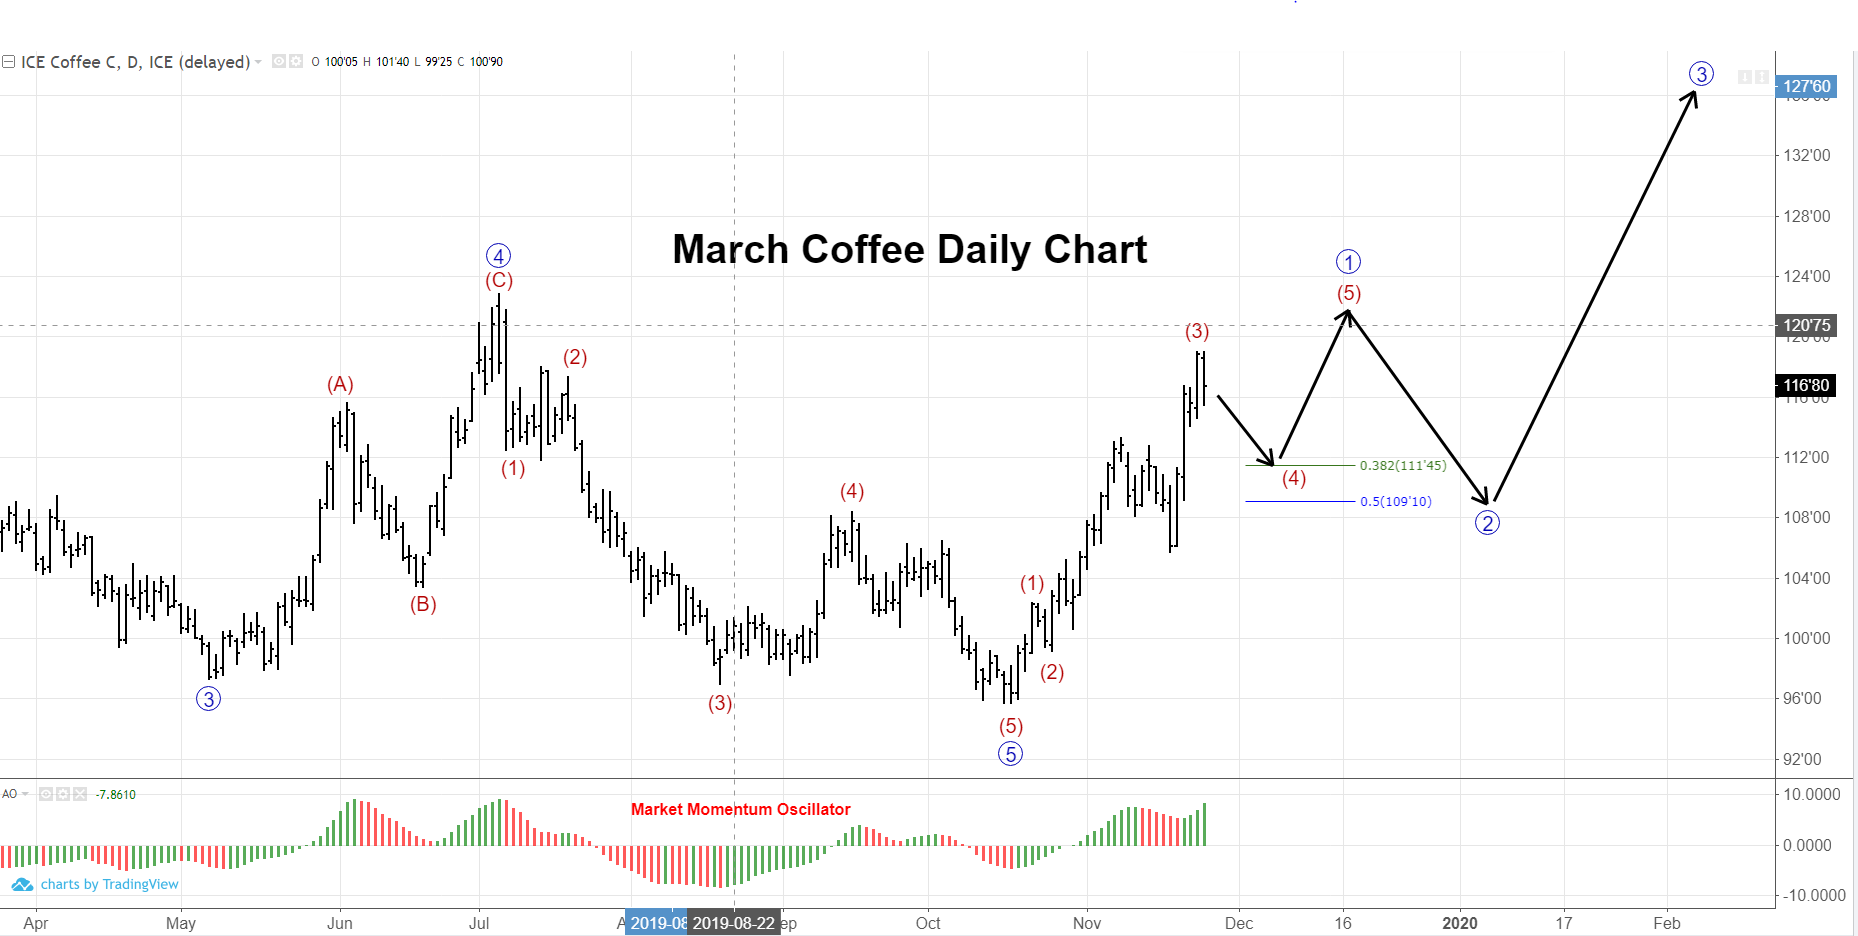
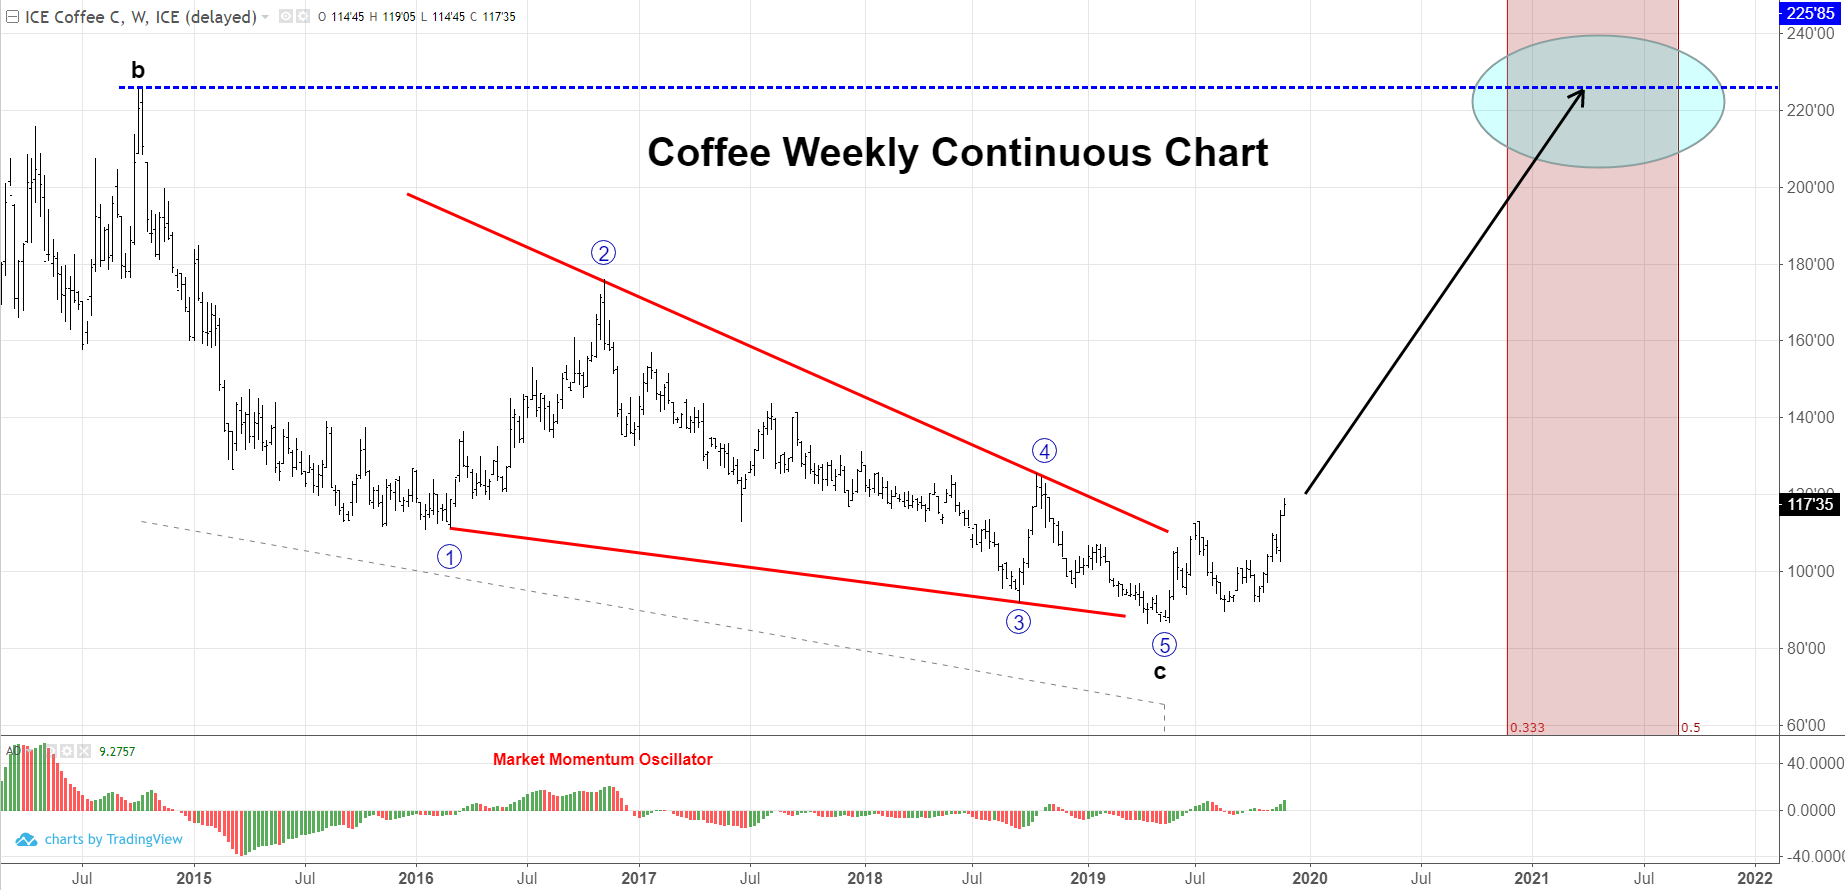
Coffee is setting up for quite the jolt in 2020. With a completed pattern terminating in 2019, and impulsive price action to the upside with confirming indicators, buyers should be aggressive to add coverage on price pullbacks.
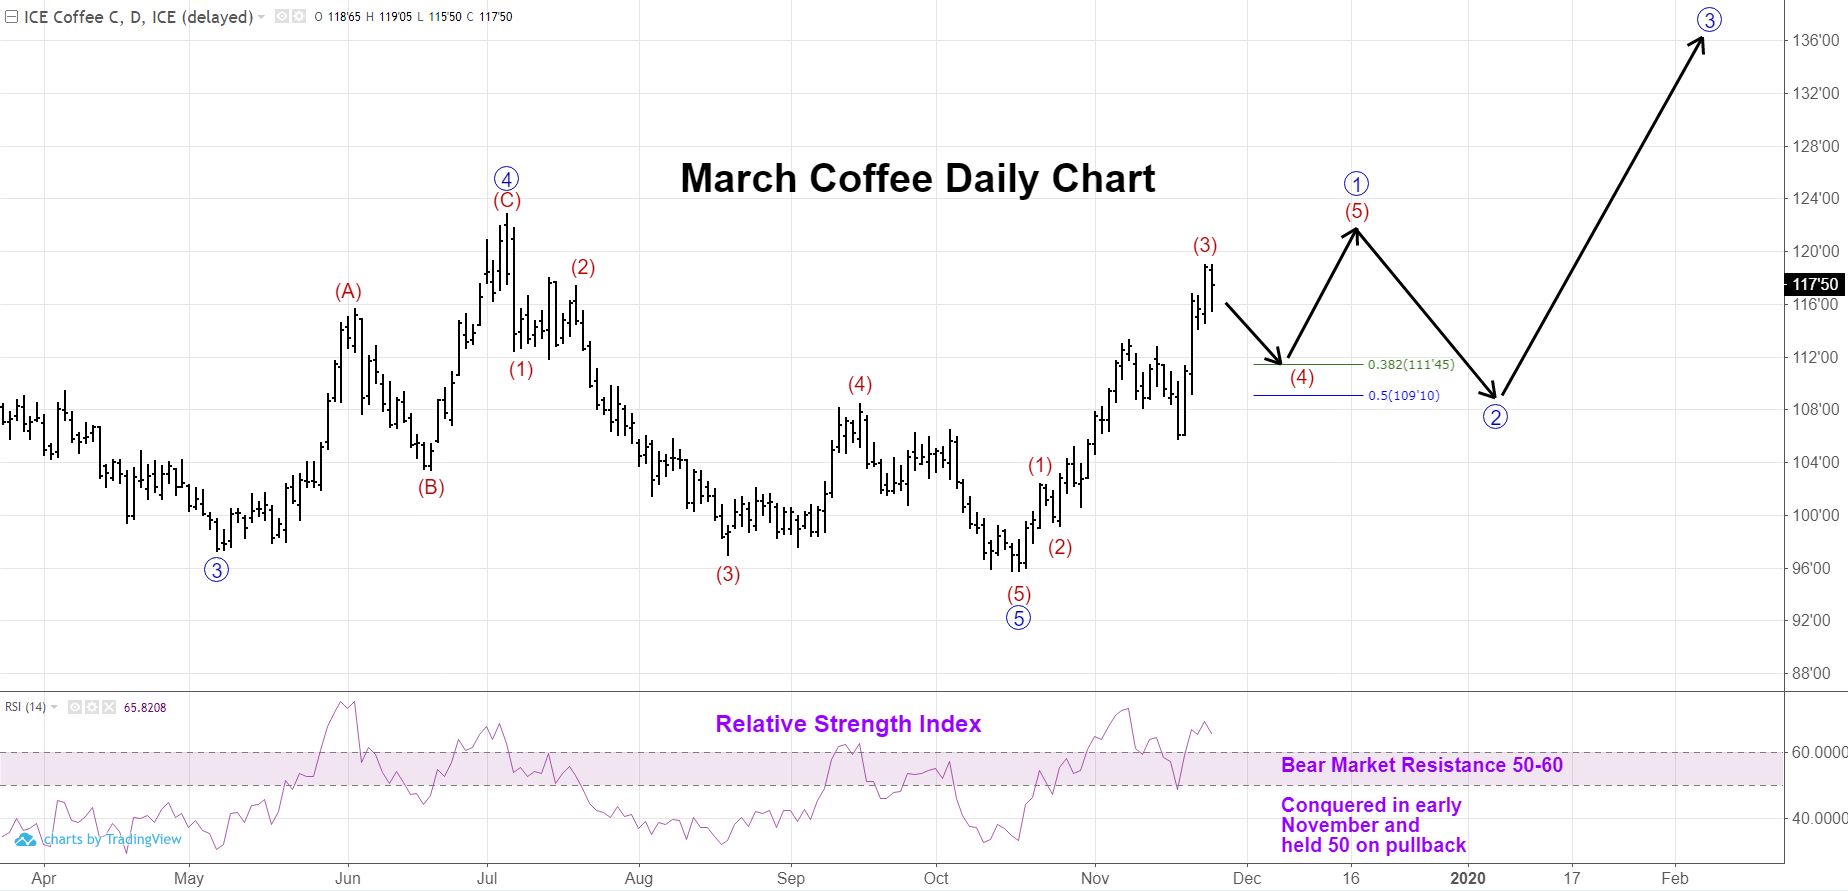
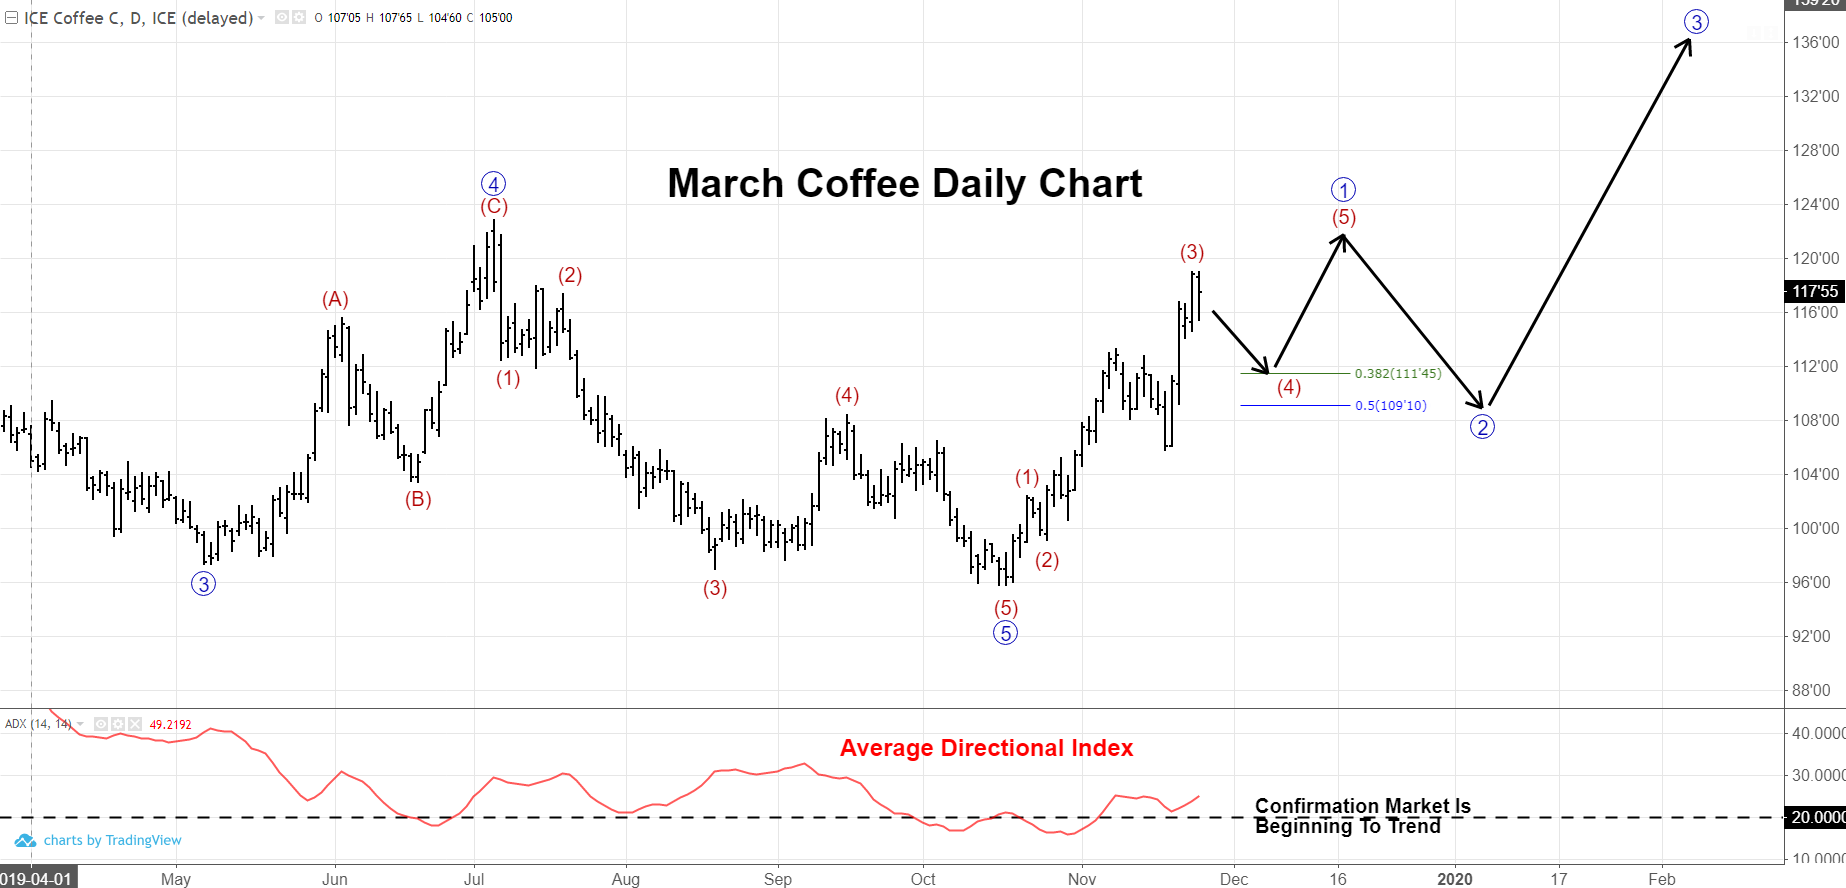
The daily and hourly charts below have momentum signatures that you would expect with the suggested wave counts. The overall trend is up. Thus, the pullbacks forecasted should be seen as buying opportunities. Because forecasting wave counts is a dynamic system of deductive reasoning that can call for adjustments, it is recommend that if your current position is “shorter” than you would like to be, use the initial pullback to add coverage. Otherwise, the wave 2 decline would certainly call for aggressive, long term purchasing.
Confirming Evidence From Other Indicators Include:
The RSI (Relative Strength Index) has conquered the bear market resistance zone of 50-60; more importantly, it held above 50 on the subsequent pullback. This is a good sign the overall trend has changed from down to up.
The ADX (Average Directional Index) has moved above 20 from below. This is indicative that a market is “beginning to trend”. With a market beginning to trend as it moves higher, that is a signal that further trending to the upside can be expected.
Finally, perhaps the most important chart to pay attention to is the weekly chart. This shows how we completed an ending diagonal (contained in the red trend lines) earlier this year. Ending diagonals have significance in Elliott Wave theory. They tend to get resolved (completely retraced) relatively quickly. A good rule of thumb is that they will completely be retraced in 1/3-1/2 the time it took to develop. Seeing that this pattern began in October 2014 with prices at 225.00 and took 4.5 years to develop, one should not be surprised if coffee futures are trading north of 225.00 in late 2020 or early 2021.
Coffee Market Fundamentals:
- The USDA’s Foreign Agricultural Service (FAS) on Thursday said Brazil 2019/20 coffee production may slide -10.5% year over year to 58 million bags from 64.8 million bags in 2018/19.
- The USDA’s FAS also forecast that Brazil 2019/20 coffee exports will slide -14.7% year over year to 35.32 million bags.
- Current Arabica coffee supplies continue to decline, which is also providing support to coffee prices, after ICE-monitored Arabica coffee inventories fell to a 15-month low of 2.145 million bags on Friday.
- Arabica coffee prices were undercut earlier this week by surveys of Brazil’s coffee farms showing “satisfactory” coffee-flowering, which supports a positive outlook for the 2020 coffee crop.
- Brazilian coffee crop concerns also eased as after Somar Meteorologia reported Monday that rainfall in Minas Gerais, Brazil’s largest arabica coffee growing region, measured 54.5 millimeters over the past week, or 110% of the historical average.
