Are Oil Bulls in for A Rude Awakening?
Although many food producers/manufacturers do not hedge with the Crude Oil market, it is a market that buyers should keep an eye on because it can be either a thermometer for economic demand and inflation or as some say, the straw that stirs the drink.
After making a low near $44 in October, Crude Oil has experienced a significant rally. Aided by supply shocks playing out in the oil-rich Venezuela plummeting their production, Iranian sanctions, and OPEC+ trimming production, the market has retraced more than 62% of the 3-month decline that began in October 2018. These stories and many other moving parts will determine the price in the future. However, as many experienced and intelligent buyers know, these driving forces will only be known to the public after they have been priced in the market—too late for a buyer to effectively manage risk. That is where technical analysis comes to help. Not only can technical analysis help you form an outlook and forecast, it can help you establish price points of where your opinion is wrong. This allows you to define risk—perhaps the most important aspect of a buyer’s responsibilities. Contrasting defined risk with potential reward by acting/not acting, a buyer can perform his duties in the market with efficiency and confidence. Tangent over.
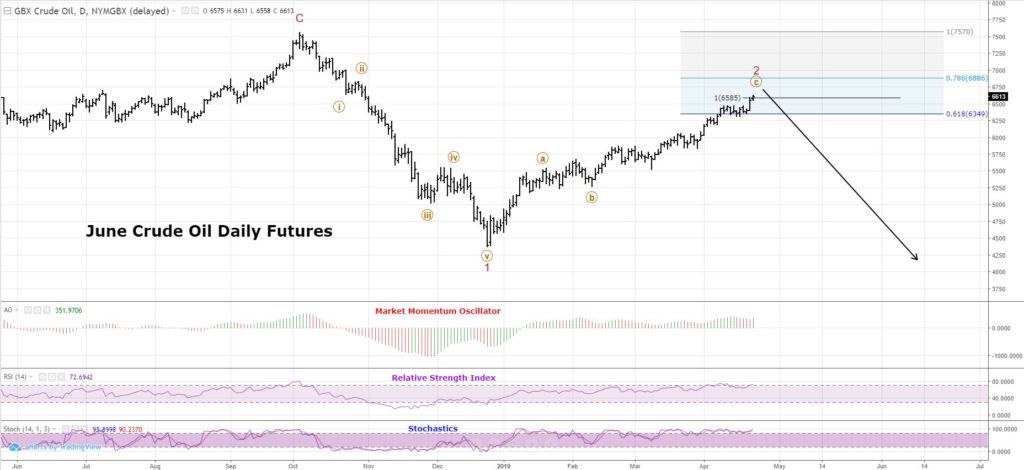
Crude oil bulls may be shocked by a move to the downside in the near future.
The move off the Christmas Eve low has been contained within parallel lines. This is indicative of something corrective, suggesting we have another decline in the near future. All the requirements have been met for a completed counter-trend rally; thus, no one should be surprised if the next major move is lower. The Risk-Reward metric on the daily chart defines where this outlook is wrong (strategy change needed) vs potential reward based upon Elliott Wave Theory. At current levels, risk reward is good, but not great.
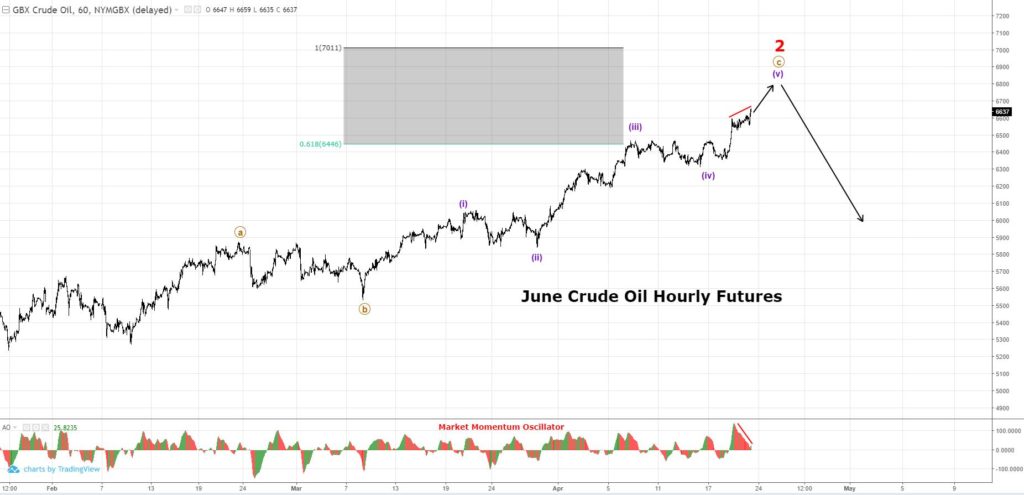
Supporting Evidence:
- Divergence between price and momentum (small on daily chart, severe on hourly chart)
- The RSI has entered the overbought territory. Although this is not the reason to sell, you can see that historically when this has happened, Crude Oil has experienced severe declines shortly thereafter.
- Stochastics are in the overbought territory. This can last a long time. Best to wait until the %K line crosses back below the 80 line.
Bullish Forces:
- OPEC+ cuts
- U.S. Economy Seems to be doing well
- IMO 2020 Regulation
- Seasonality Until June
- Supportive Central Bank Policy Recent statements by Federal Reserve officials suggest they are looking to determine the appropriate conditions for introducing an interest-rate cut, though one is not believed to be imminent. Federal Reserve Bank of Chicago President Charles Evans stated last week that a prolonged period of inflation below 2% would imply that “our setting of monetary policy is actually restrictive, and we need to make an adjustment down in the funds rate.”
Bearish Forces:
- U.S. Production
- Russian Talking of Turning On Spigots Again
- Global Manufacturing