This is a follow up from our August 6th post, “December Corn Technical Outlook”
They say, “the quickest way to the poor house is to trade government numbers”. Some will attest to that statement in recent weeks. Much has been said, and lots of heads are scratching on the monthly WASDE reports (estimates) from the USDA. The spectrum of possibilities given by traders explaining the statistics ranges from different measurement methods to claims of complete incompetence to accusations of nefariousness. Whatever the case, it is the bottom line (personal or company) that is most important and we cannot worry about the past, only look for the signals the market is giving right now.
Below are three wave interpretations for the corn market. Two of them call for much higher prices, while the third suggest the overall trend is lower; however, a 3-wave rally is imminent. This means all 3 suggest there should be some relief in this relentless break the past week or so.
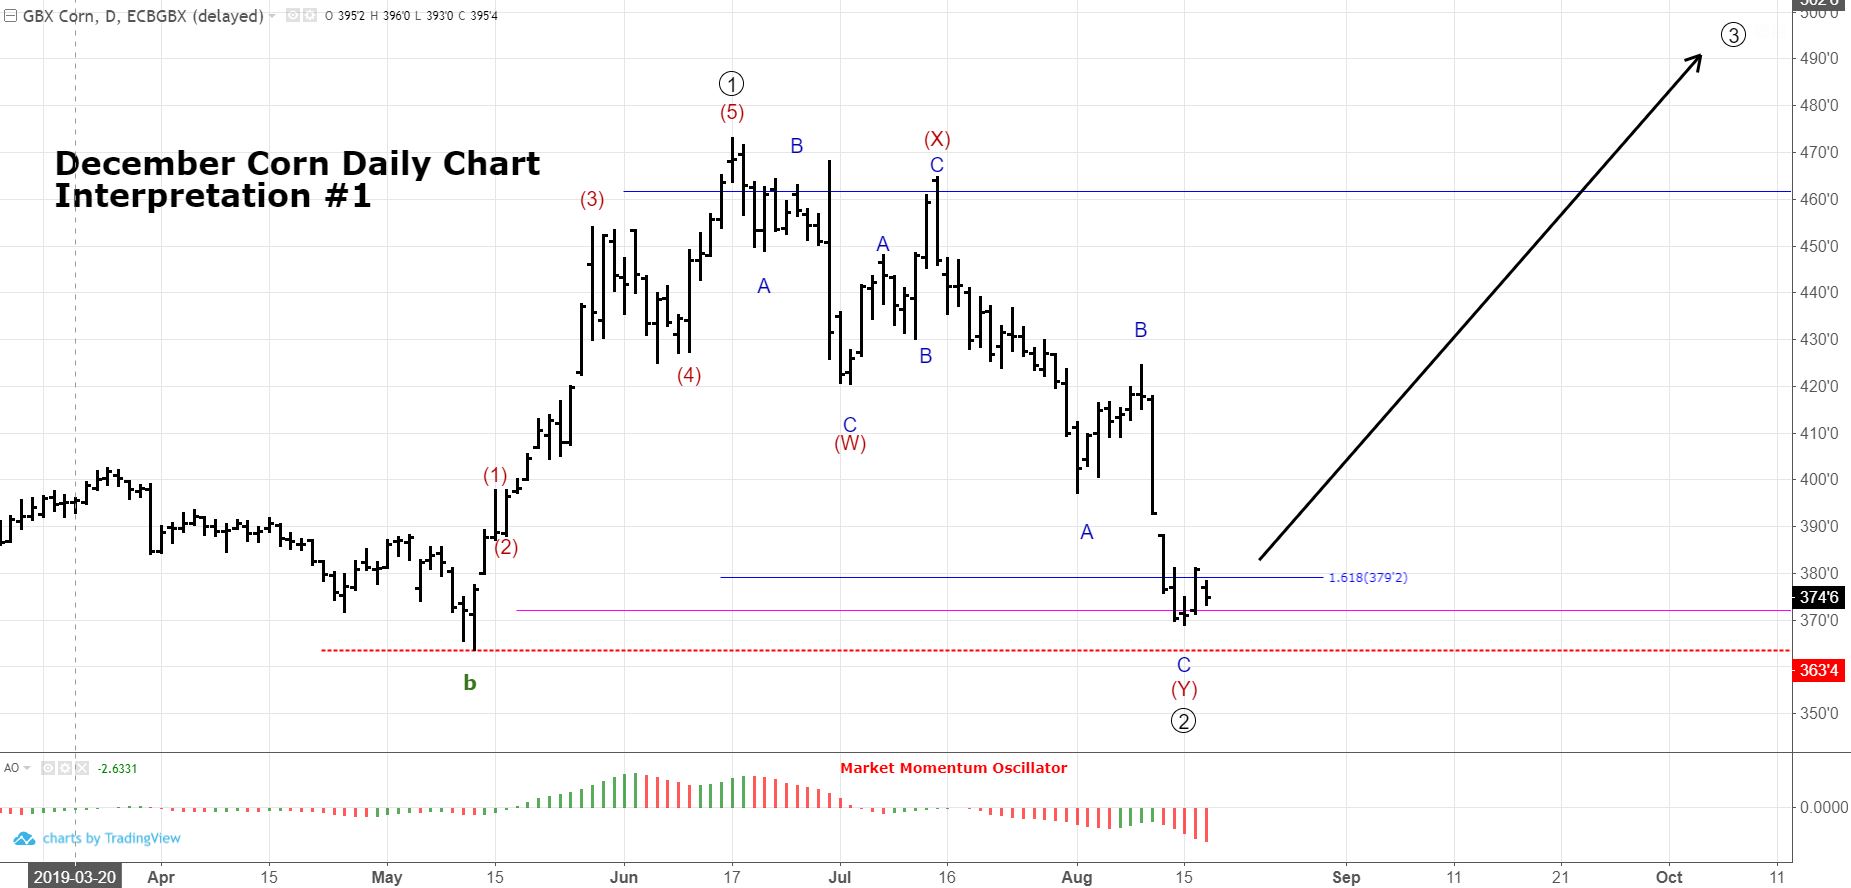
December Corn Interpretation #1
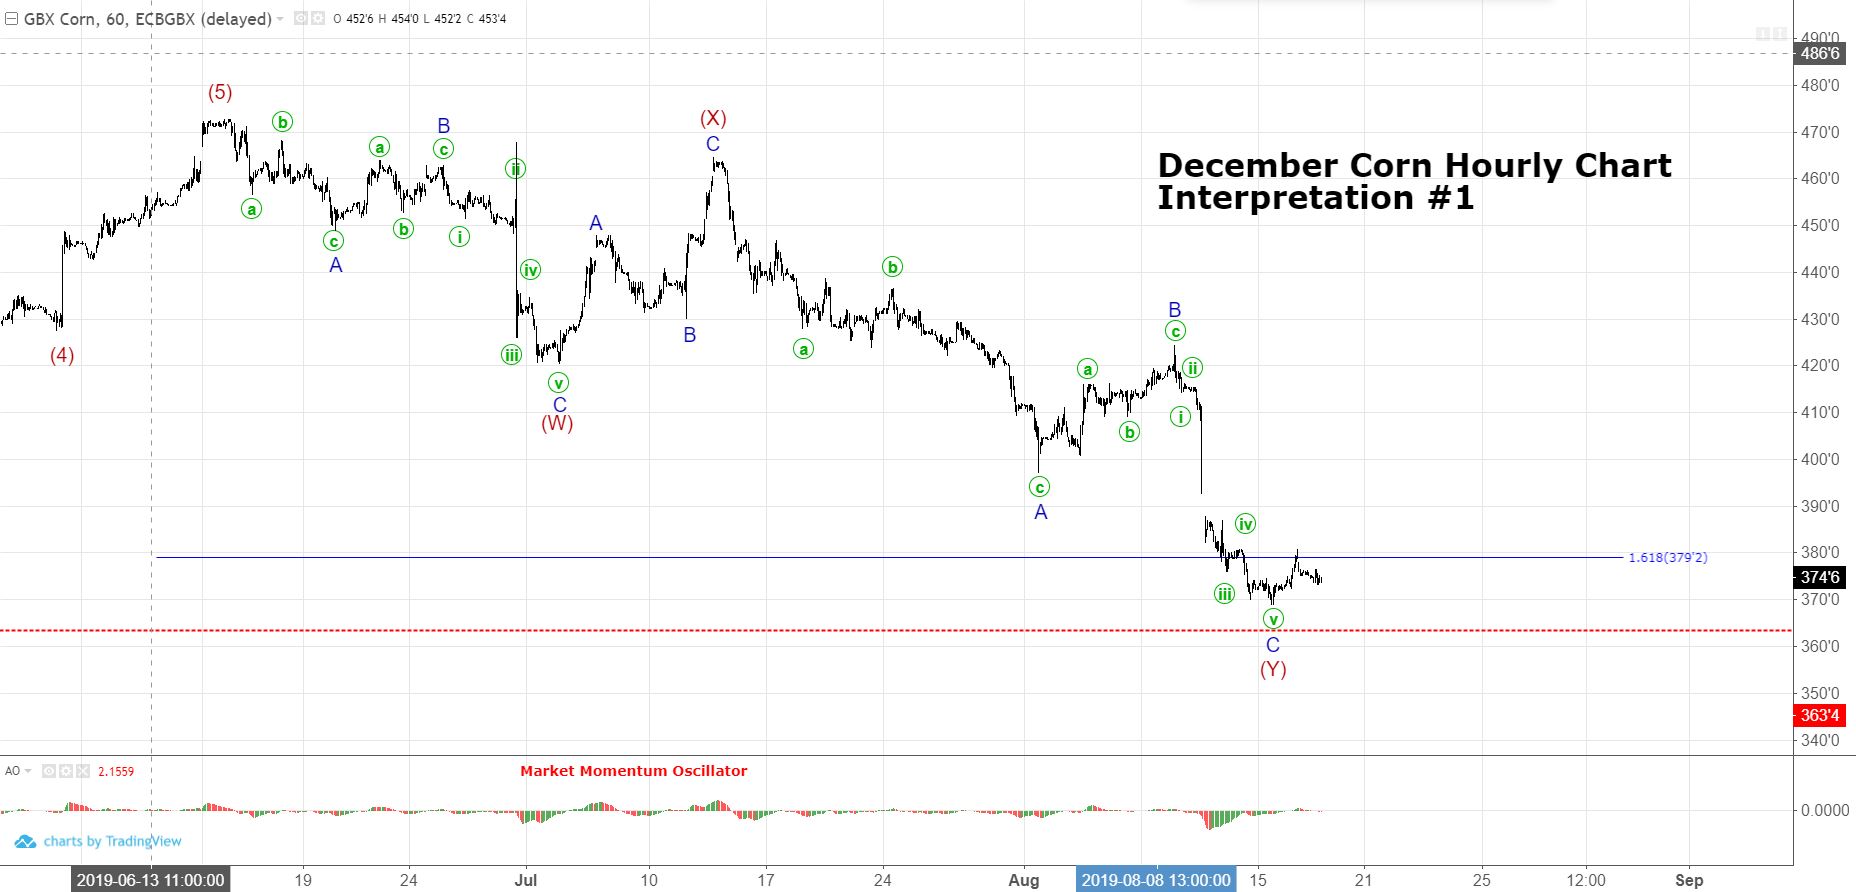
The drop from mid-June is a vicious, combination that forms a double zigzag. Here, wave (Y) is near 1.618*wave (W). This 1.618 multiple is common in impulse waves which makes this vicious correction and confusing for Ellioticians to count. Looking at the subdivisions (3-3-3), the call is to make this an expanded flat and not an impulse. This would mean the wave 2 correction is near completion and we can expect much higher prices in wave 3. This is most like our original interpretation. Critical support for the interpretation is the red, dotted line that signifies another new low from May. Elliott rules state, wave 2 can never go beyond the start of wave 1; thus, if a new low occurs, this wave count is invalid and back to the drawing board.


Any decent Elliottician will have an alternative wave count (perhaps multiple counts) and then use the method of deduction to see which interpretation is most probable at any given moment. It plays into the good practice for any buyer/trader to ask, “Where am I wrong?” or “Is there any risk I am not seeing?”
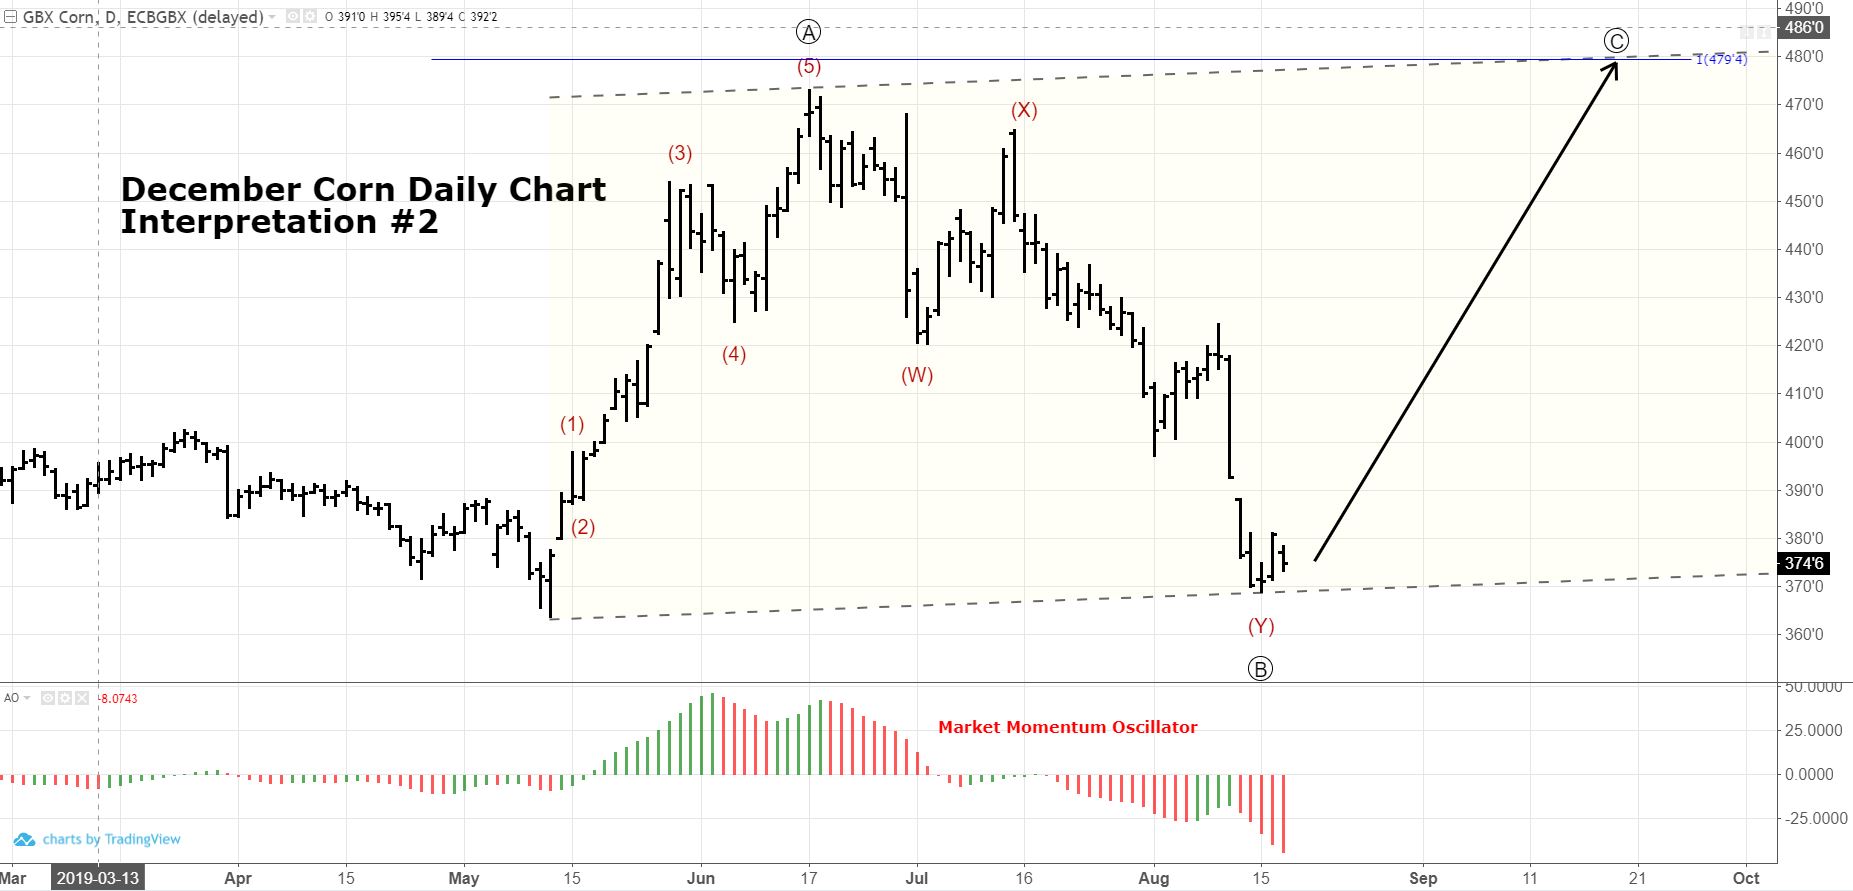
December Corn Interpretation #2
The second interpretation of the December Corn Chart is below. Here, we have the entire move from mid-May a wave 4 correction (subdivides A-B-C) of the overall trend. The subdivisions on the hourly chart would be very similar to interpretation #1. In the case of #2, we should be starting wave C of 4. We would expect wave C to be about the same length as wave A and the entire wave 4 to remain within parallel lines. This puts the upside target near $4.60, a much higher value than today.

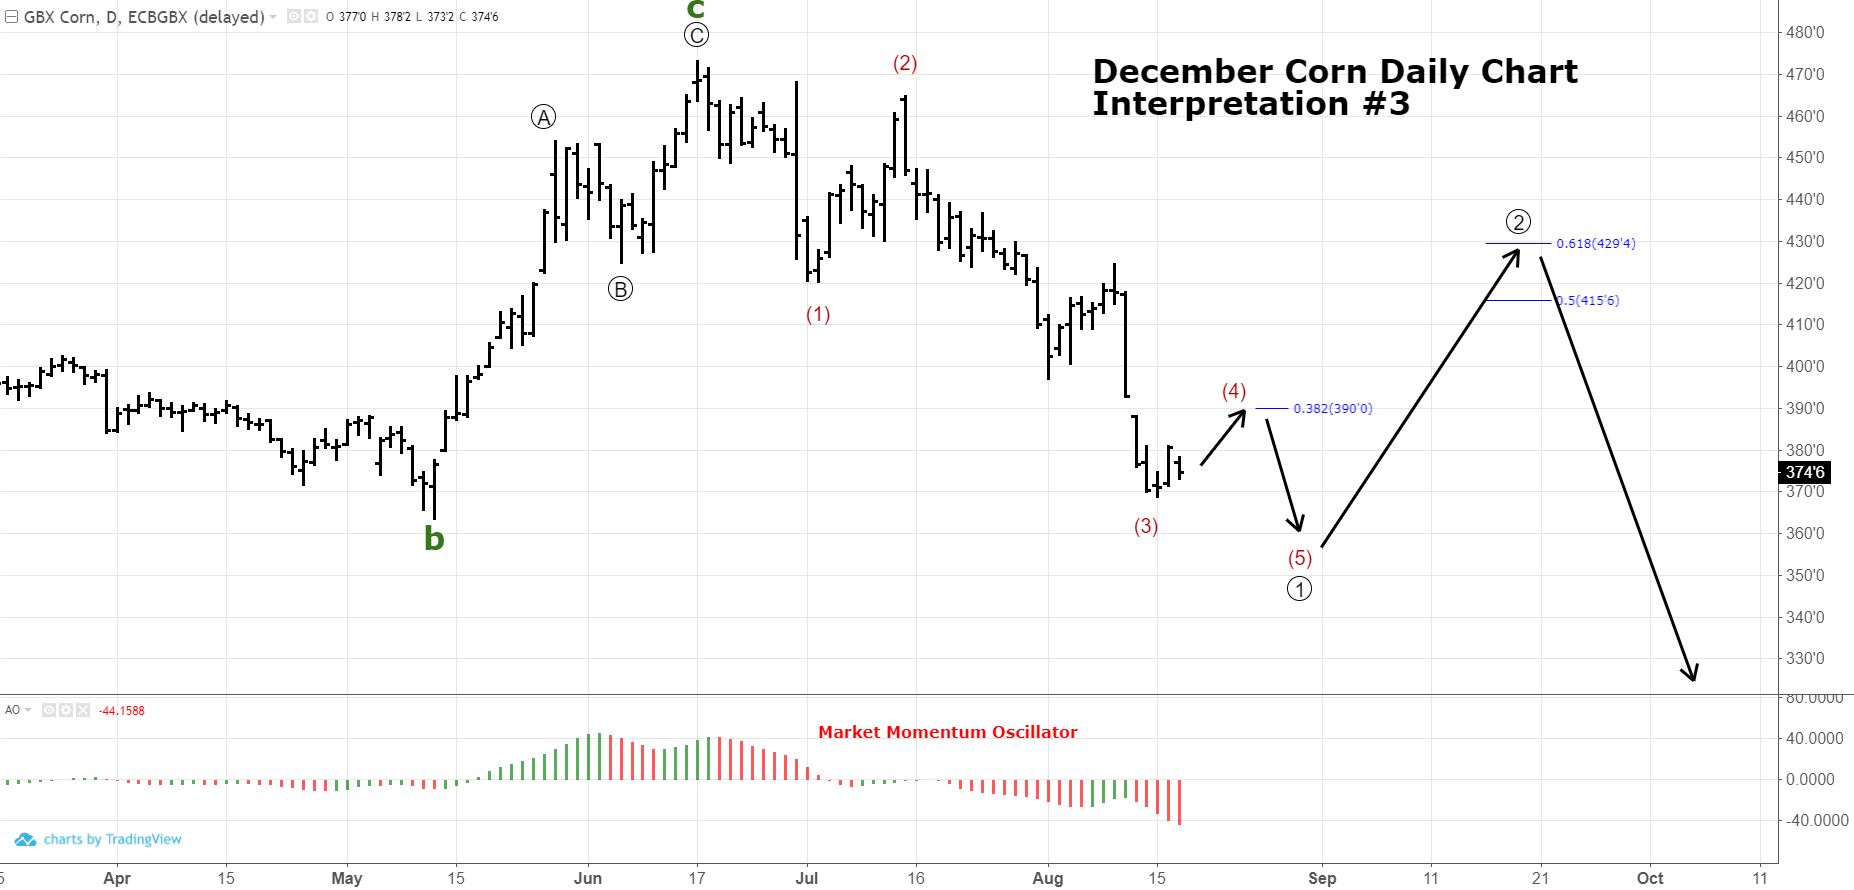
December Corn Interpretation #3
The final interpretation to look at today is the one that suggests the top was in last June and the overall trend is lower. The subdivisions are not as easily countable as the first two interpretations; however, the fact that the most recent low is accompanied by the highest momentum can suggest more lows are in the future. In interpretation #3, the forecast is to see one more up-down sequence this month to finish wave 1. Then, at the start of September, prices would begin a counter-trend rally (wave 2) that would last about 30 to 45 days and retrace 50-62% of the decline that began on June 16th. This puts the upside target at $4.15-$4.30….a much better level than we are currently seeing.
