Gold had another significant move today (+2%) and has quite a nice rally that began in late-May. However, this move may have limited upside and could be in for a corrective wave lower before making new highs again in early 2020.
Gold, like copper, can be used as a sentiment index to see how investors feel about the economy. Gold is often referred to as a fear index. If investors are fearful of economic instability or inflation, they will purchase gold as a hedge, or protection. If investors believe all is hunky dory in the economy, gold will get little attention and retreat lower. Below is a technical take on the gold futures market.
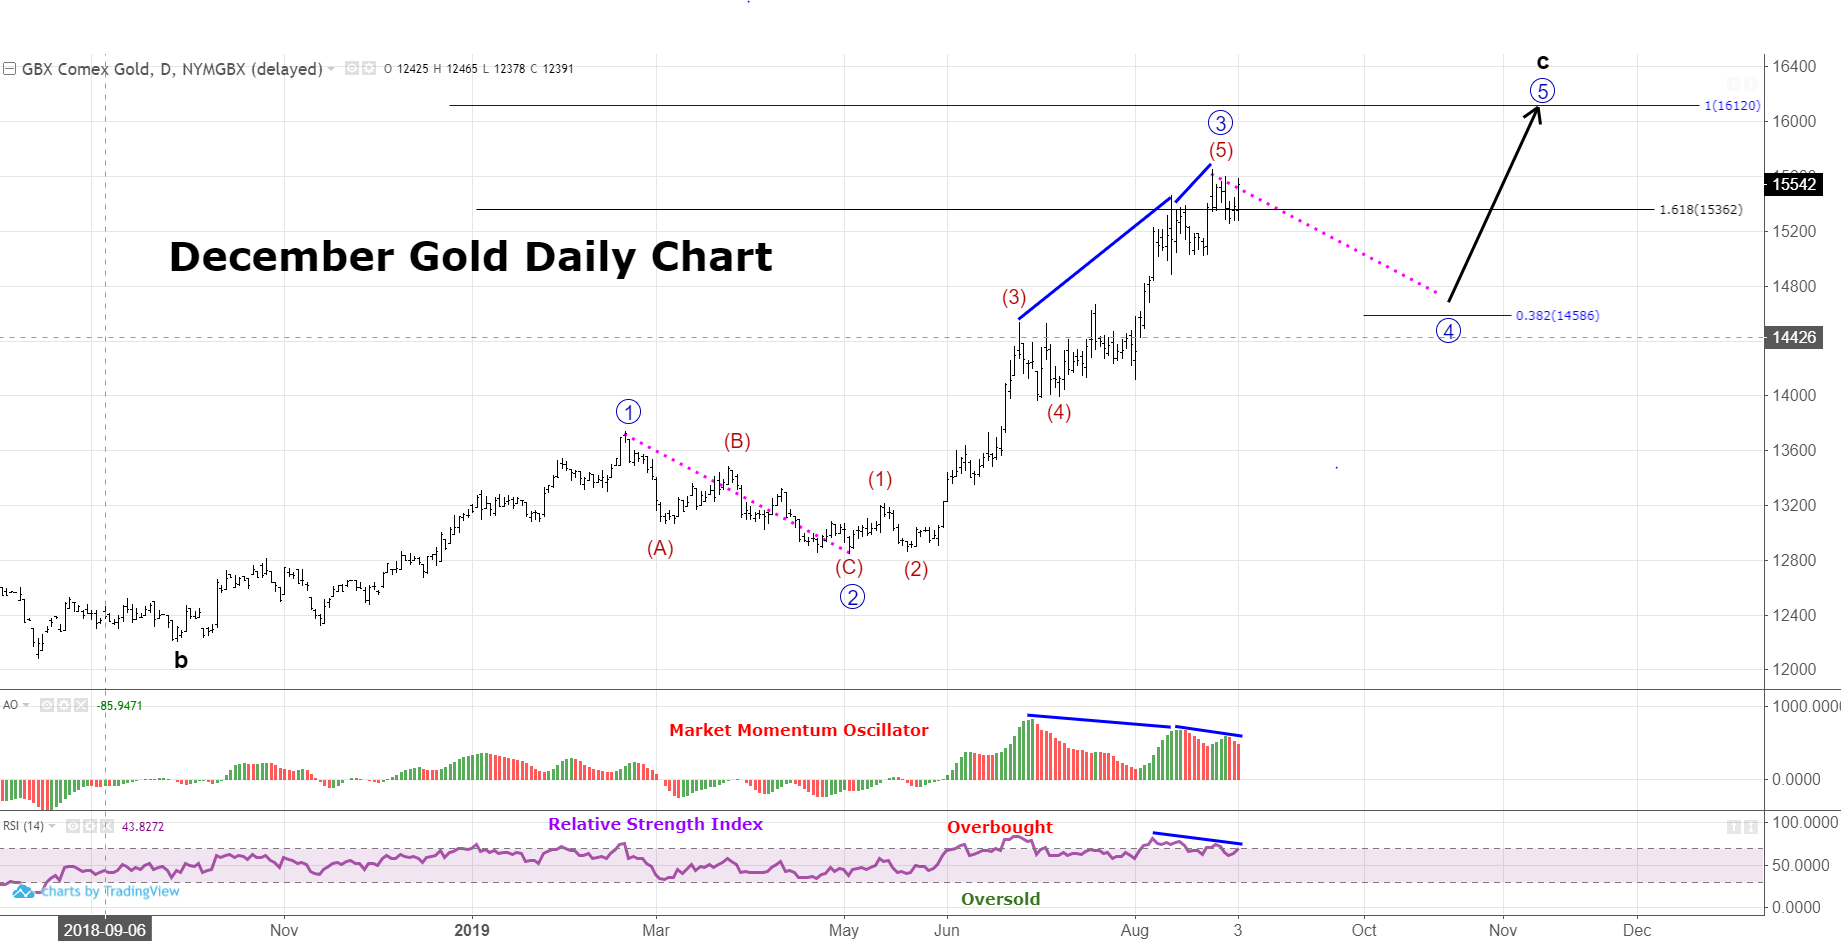
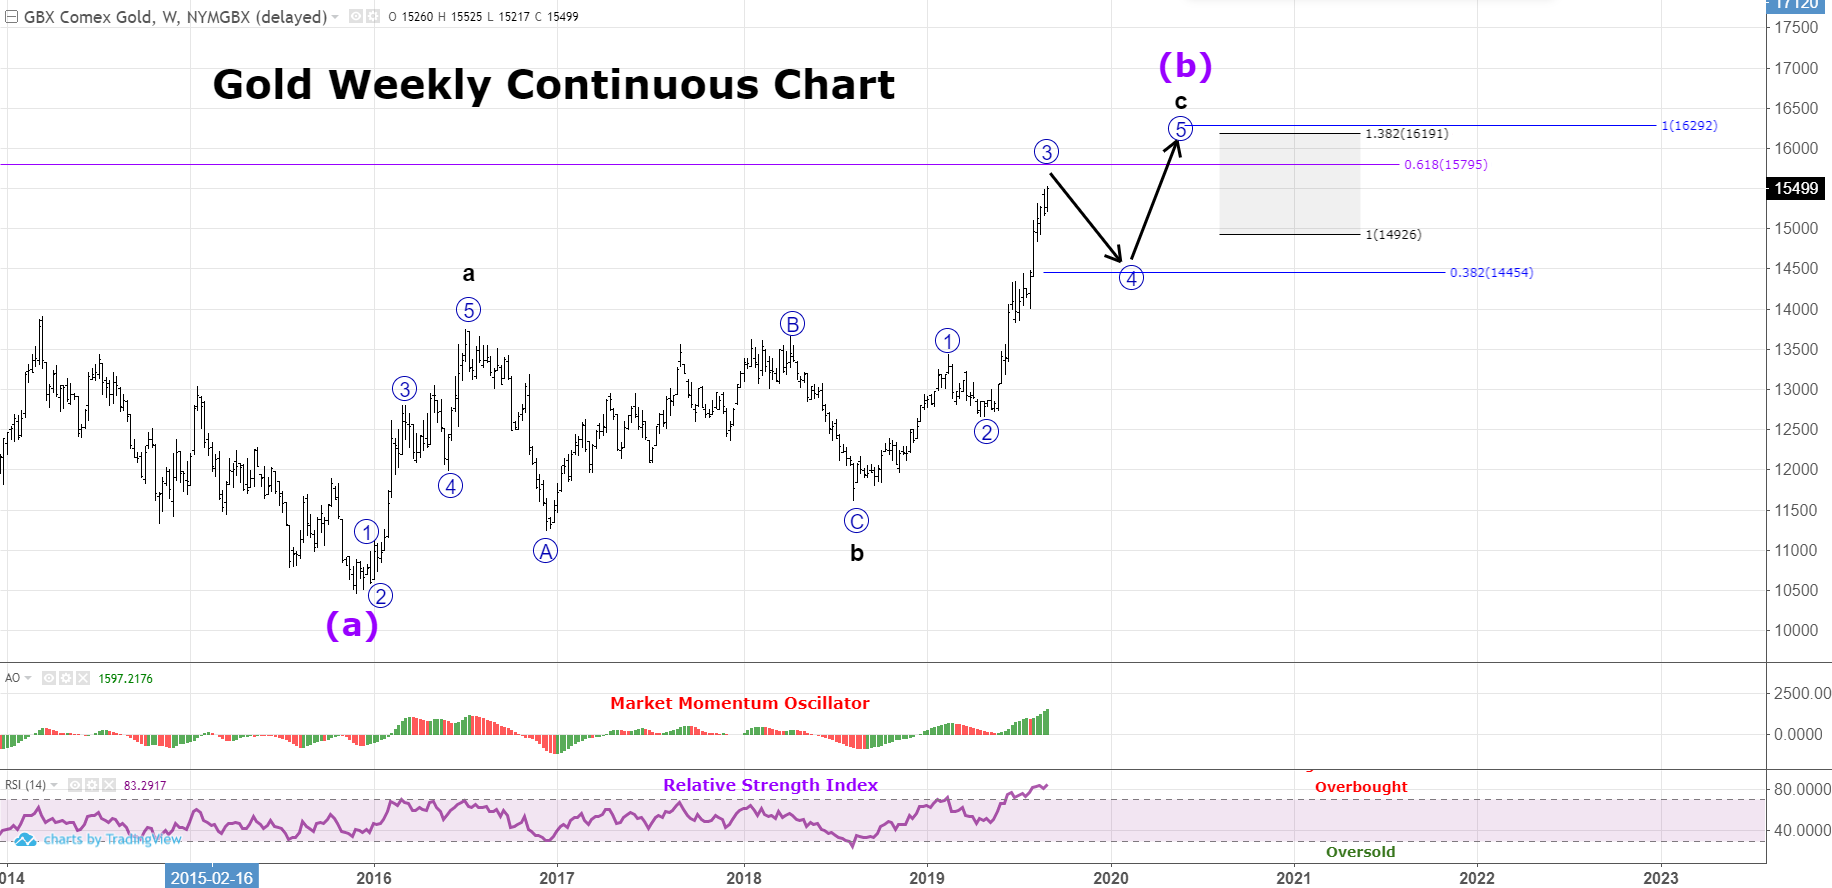
Forecast: Gold will see a three-wave correction (A-B-C) in wave 4 back to the $1,425-$1,460 area that should last 2-3 months. Subsequently, we then should see a rally in wave 5 of c of (b) to the $1,580 to $1,630 area. Based on other technical indicators at that point, we can decide if that that level is an interim, or longer-term top.
Advice: Picking tops can give you bloody noses. To fade this tiring rally with good risk-management skills, it would be wise to wait for a 5-wave decline on an hourly chart, followed by a 3-wave rally. This increases the chances that the current uptrend is indeed pausing and will retrace in wave 4 of c. That way you will avoid getting steamrolled by a bigger than expected wave 3 rally. It is good risk-management practice to do so.
Explanation and charts with evidence below.
Expectations are for a wave 4 pullback (wave 4-circled) back near the $1,400-$1,455 area. This area is the span of the previous 4th wave of one lesser degree—an expected target. (Note: $1,458 is a .382 retracement of wave 3-circled and $1,425 is a .500 retracement). This retracement should last about 2.5 months (see pink, dotted trend lines), as did the corresponding wave 2-circled correction. Once that is complete, it can be expected that gold make another push higher in wave 5-circled of c of (b). If the length of the wave 4 pullback holds true as forecast, I would put the final upside target in the range of $1,580-$1,630. This area has a nice Fibonacci cluster. That is the following:
- $1,580 is where wave (b) is a .618 retracement of the wave (a) decline (weekly chart).
- $1,619 is where wave c = 1.382*wave a (weekly chart).
- $1,595 is where wave 5 = wave 1, if wave 4 is a 50% retracement (weekly chart).
- $1,629 is where wave 5 = wave 1, if wave 4 is a 38.2% retracement.

Things to notice on daily chart as evidence for wave count and forecast:
- Double Bearish Divergence in Momentum and Price (good at forecasting reversal)
- RSI was in overbought territory twice with divergence and has not gone below that overbought level (very indicative of imminent reversal)
- Wave 3-circled has traveled the expected 1.618 multiple of Wave 1-circled.

Things to notice on weekly chart as evidence for wave count and forecast:
- RSI is in overbought territory (can be precursor to reversal)
- Wave (b) has retraced a near .618 of the wave (a) decline
- Momentum suggests we should see another new high in the future on less momentum (that would be wave 5 of c of (b).