This post is a follow up from our November 5th post, December Kansas City Wheat Futures.
Prices Edging Higher in Kansas City Wheat Futures
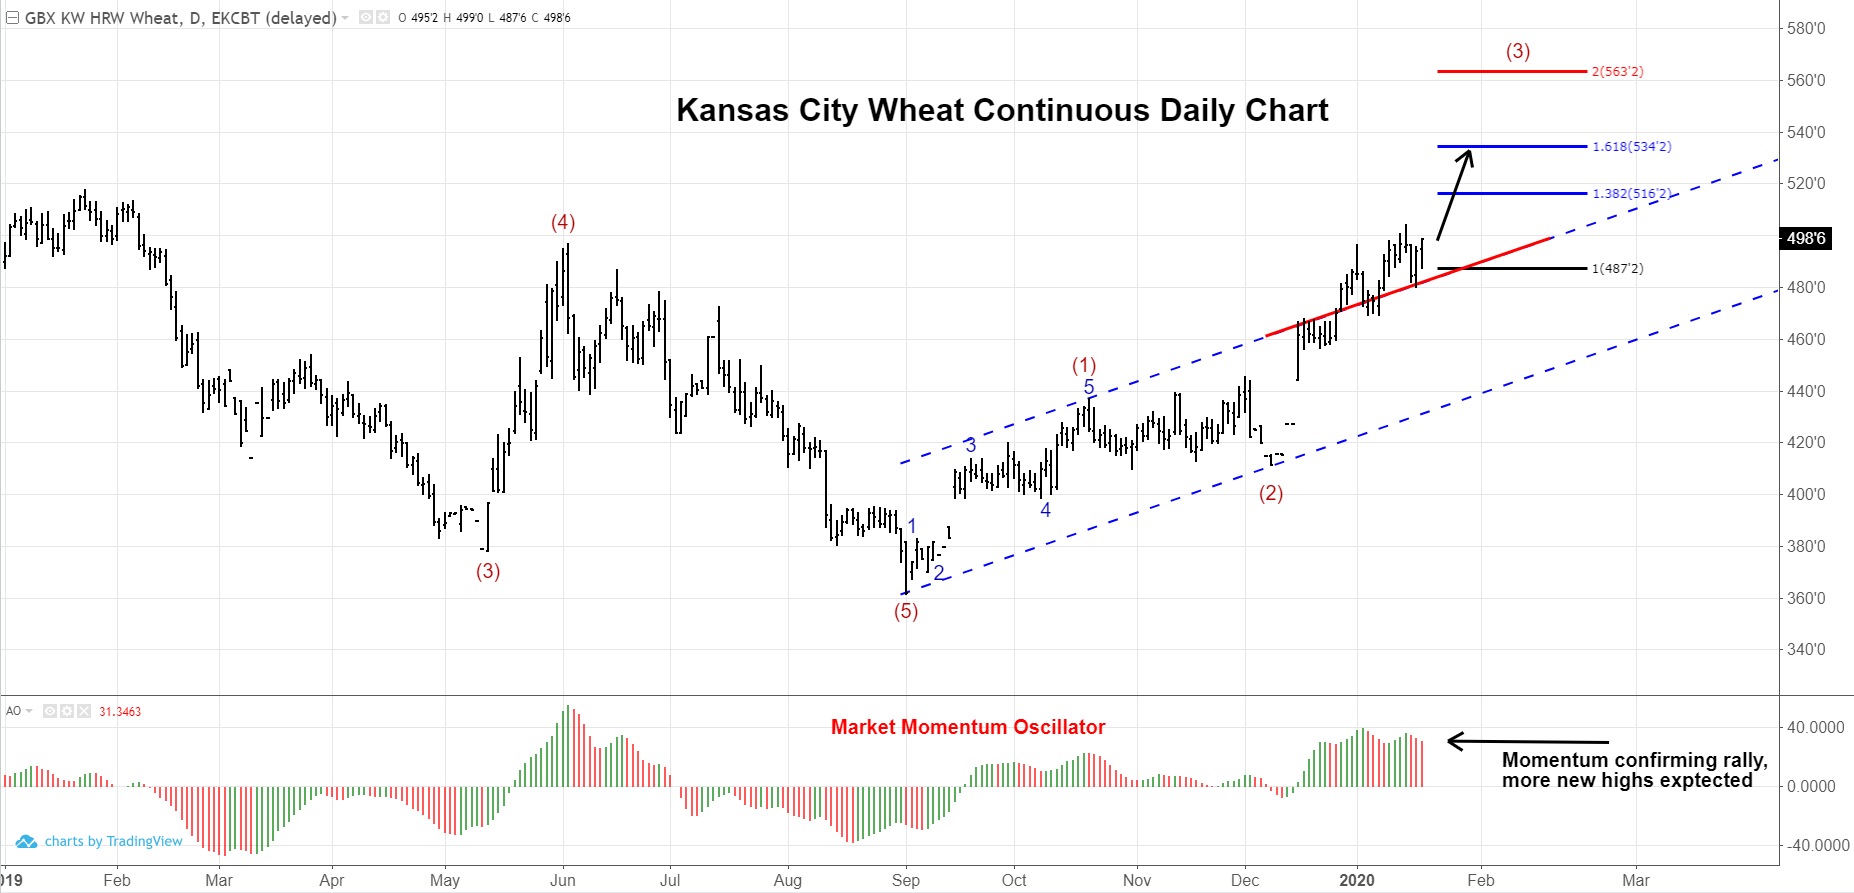
As expected in the November 5th post on Kansas City Wheat, prices have moved higher. Again, with an initial 5-wave move off the bottom made on September 3rd, Kansas City wheat is poised to make new highs in the coming weeks/months. The only core patterns of Elliott Wave that begin with a 5-wave move are the Impulse, Leading Diagonal (at times), and the Zig-zag. All of these patterns call for a new price extreme in the direction of the current trend whether it is a wave 3 (violently higher) or a wave C higher.
Given the momentum signature and the establishment of prices above the price channel, probability suggests we will see a wave 3 higher as opposed to a wave C higher that would ultimately fail.
Daily Chart
- With prices rallying and stabilizing above the corrective price channel, this suggests we have more price action and bigger waves to the upside.
- Momentum on the Daily Chart is confirming the most recent highs. This would suggest we should have more upside price action.
Looking at other technical indicators for clues of confirmation or concern, we see the following:
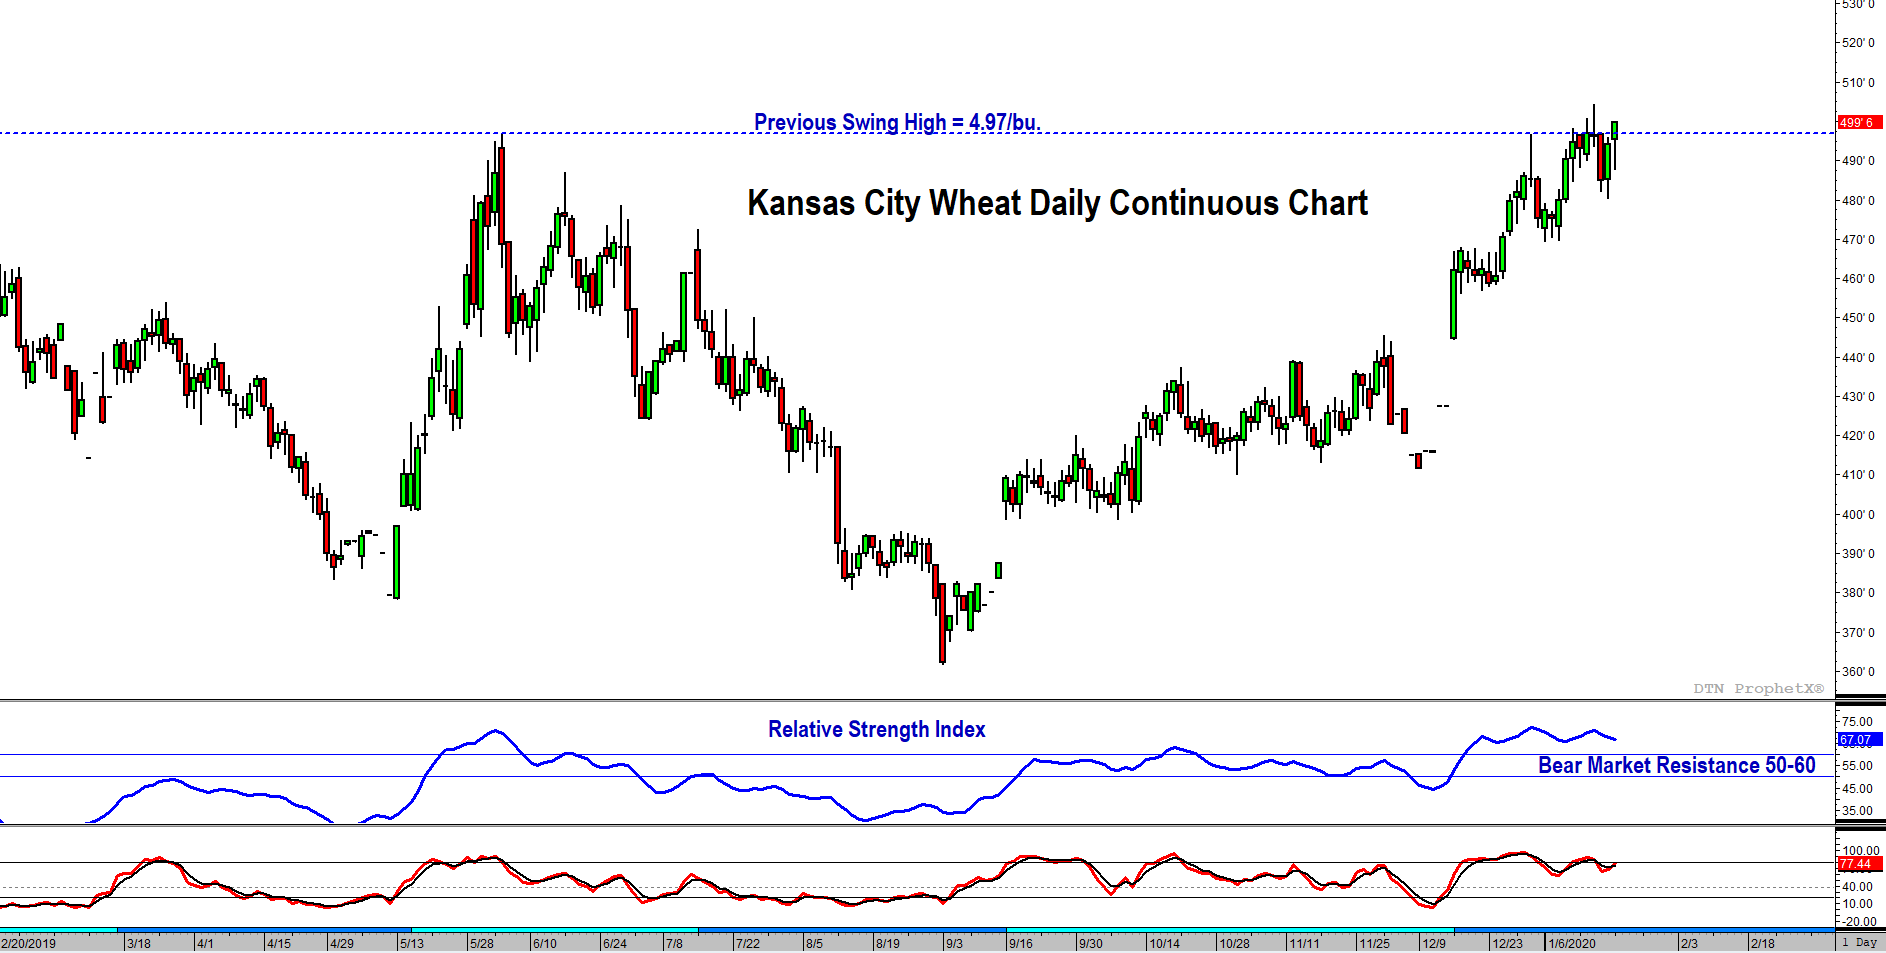
- Prices have recently pierced the level of the previous swing high back in May 2019. Acceleration higher will provide confirmation.
- RSI has taken out bear market resistance (60), confirming that the previous downtrend is over, and an uptrend has been established.
Despite the oversupply situation in recent times for world wheat, expect prices to continue to move higher in the near-term; first target $5.16-$5.34.
Fundamental Information Headlines:
- Dryness continues to be a major concern with continuous rainfall deficits in Eastern Europe, the Ukraine and some parts of Russia. Wheat in these regions is increasingly at risk of damage from freezing conditions if temperatures drop.
- Estimates of total EU 2020/21 wheat production are over 3% lower than 2019/20 production which may help support prices along the curve.
- Exportable stocks in the EU and Black Sea are beginning to tighten and may help support price.
- US winter production appears to be relatively good shape but it is still early days.
- Global wheat prices up, US prices following
- Winter wheat acreage down 400,000 to lowest since 1909 with some areas failed to emerge.
- 2019/20 SRW carryout and stocks in deliverable position is projected smallest since 2007/08.
- HRW and HRS stocks in deliverable position also at diminished levels.
- Major exporter ending stocks are projected to be lowest since 2013-14; usage ratio down to 15.1% from 15.6% last month.
- China deal could add new export demand, most likely for higher protein wheat
- Argentine export tax supportive for US exports.

