This article is a follow up to our Lean Hogs Technical Analysis Update published on April 2.
Would You Rather Be Right Or Make Money?
This is a question every buyer/trader must ask themselves. Certainly, when it comes to risk management, ego and the will to be right can get you into a lot of trouble.
Fortunately, when using a deductive reasoning method that explains price action like Elliott Wave, you don’t always have to be right to make money. Below are 4 valid interpretations of the lean hog market. Three of them point to higher prices, one does not. As price action unfolds, the rules and guidelines of Elliott Wave theory will eliminate the possibilities of 2 or 3 of these interpretations, adding increased probability of a final forecast.
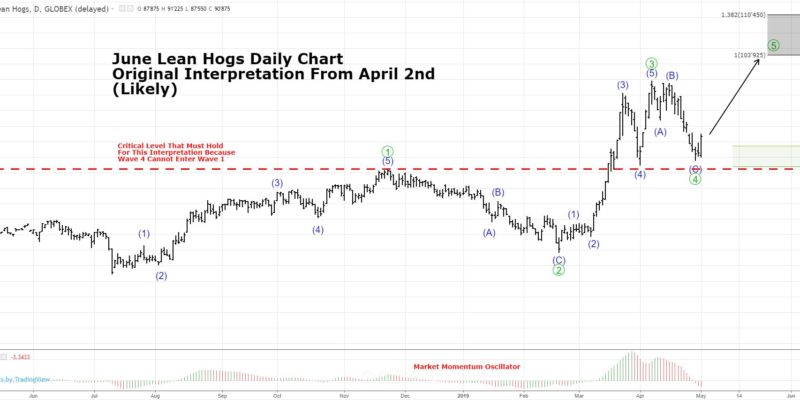
Interpretation #2 (above) is our original interpretation from April 2nd. Although this interpretation is still very valid, we are not sure it is completely correct. Prices have unfolded as forecasted with remarkable accuracy. First from the $90-area up to $99.82 (forecasted target of 99.50-100.50), then back down to $87.02 (forecasted $88.00 area with critical support level of $85.25), and now prices have rebounded, as expected. However, other characteristics of the waves and their personalities (mainly time frame) have us thinking the original forecast may be incorrect. The issues we have with our original interpretation are the following: (1) wave 4-circled took an incredibly short time to play out–only 1 month. In comparison, wave 2-circled took 3 months. This is not breaking any rules and the wave is still valid, but it adds doubt to the forecast. (2) The subwaves (A), (B), (C) of wave 4-circled are difficult to count. Ultimately, we have an expanded flat, but wave (C) seems too large in comparison to wave (A). Again, this is not breaking any rules, but it doesn’t exactly fit the guidelines of the theory.
Alternative Lean Hogs Wave Counts
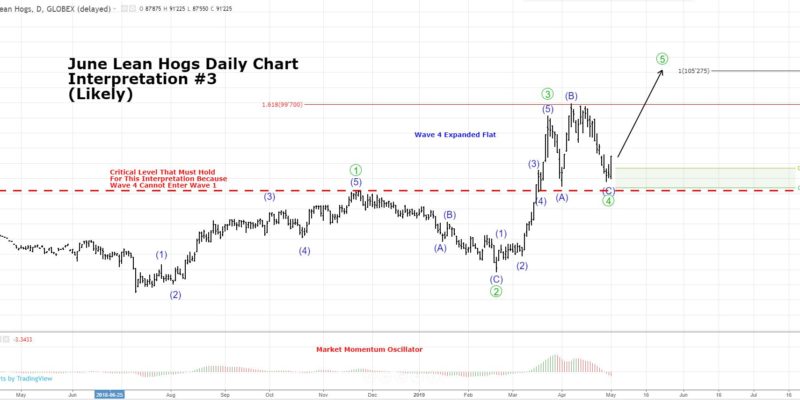
This constant questioning of the original forecast leads us open to other interpretations. For example, Interpretation #3 (below) is also valid and the wave 4-circled has more balance and time. However, the subwave (C) is difficult to subdivide into 5 waves, a requirement for flats.
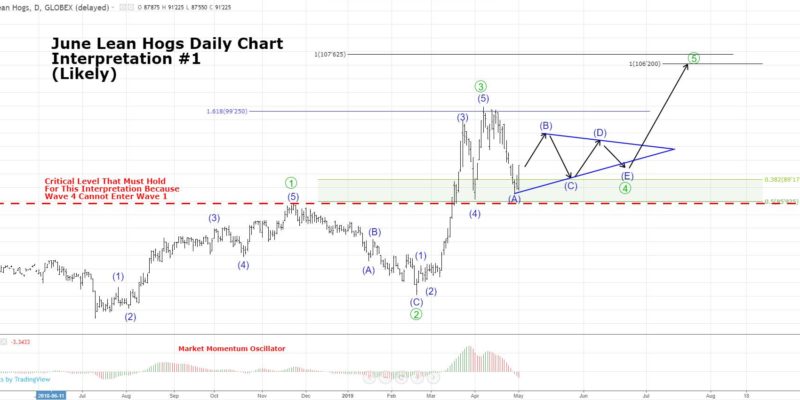
Just as valid, if not more that our original forecast, is interpretation #1 (below). Here, we see wave 4-circled just beginning and ultimately it will play out over time in 5 subwaves (A-E). This interpretation solves for the time issue and the subdivision issue we have with our original interpretation #2. It is important to know that triangles take time and will f*@k the impatient trader up. Ultimately, it whipsaws traders into exhaustion and loss of monetary and emotional capital to the point that when the triangle is complete and opportunity arises, most are too depleted to see it and take advantage.
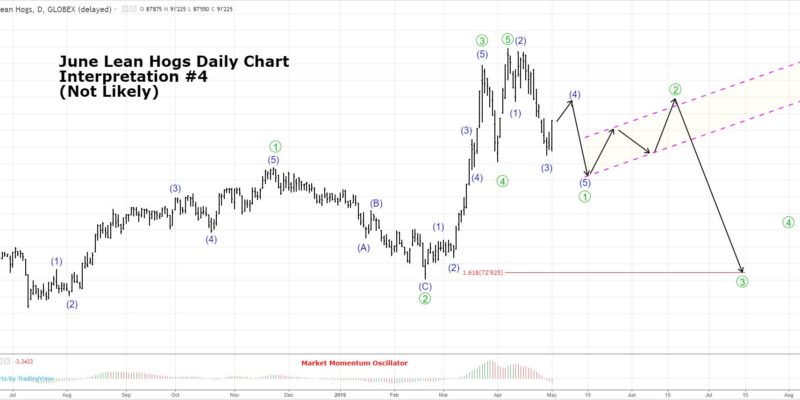
Lastly, Interpretation #4 (below) is the devil’s advocate outlook. One should always ask, “when and where am I wrong it this market?” Interpretation #4 is that outlook. Here, the top is in and we are in wave 1 or A of a larger move to the downside.
In short, you don’t have to be right to make money. The market is always a set of probabilities. As price action unfolds, you can skew the probabilities to the more probable and make educated bets on those possibilities knowing that no system is 100% correct. Like any good trading system or model, Elliot Wave is an excellent map of the forest with no trail names on it. It will help you navigate through the uncertainty. Sometimes you will know exactly where you are going and sometimes you will be at a crossroad that looks like the one you see on your map, but ultimately, its not where you think you are. I’ll take this map, knowing its limitations.
Summary
Of the 4 interpretations, three point to higher prices. This skews the most probable scenario to be higher. Fortunately, using the rules of Elliott Wave theory to know exactly where we are wrong. Rule 10 of Impulse waves explicitly states “Wave 4 cannot go beyond the end of wave 1”. One the three bullish interpretations, Wave 1-circled ended at $85.52. Thus, if we get a closing price below that level, our interpretation is no longer valid and the reasoning for our position is incorrect. That is you risk parameter. You know ahead of time where you are wrong and how much you are risking.
What to do? Stay long the hog market as long as closing prices are above $85.50. As price action plays out, Elliott Wave rules and guidelines will dictate which of the three bullish interpretations is most valid. Fortunately, all three forecast prices in the $105.00 area. It also should be noted that this is a minimum target. The lean hog market is primed for a blow-off, extended wave 5 top with the ASF situation. It doesn’t mean we will see that, but it will be prudent not to get short at $105 and perhaps leave some long positions on, tightening your stop loss levels. The potential reward will be worth the risk.


