This is a follow up from our August 16th post, A Reinforced Case for a Bullish Edible Oil Market
November Soybeans Edging Higher?
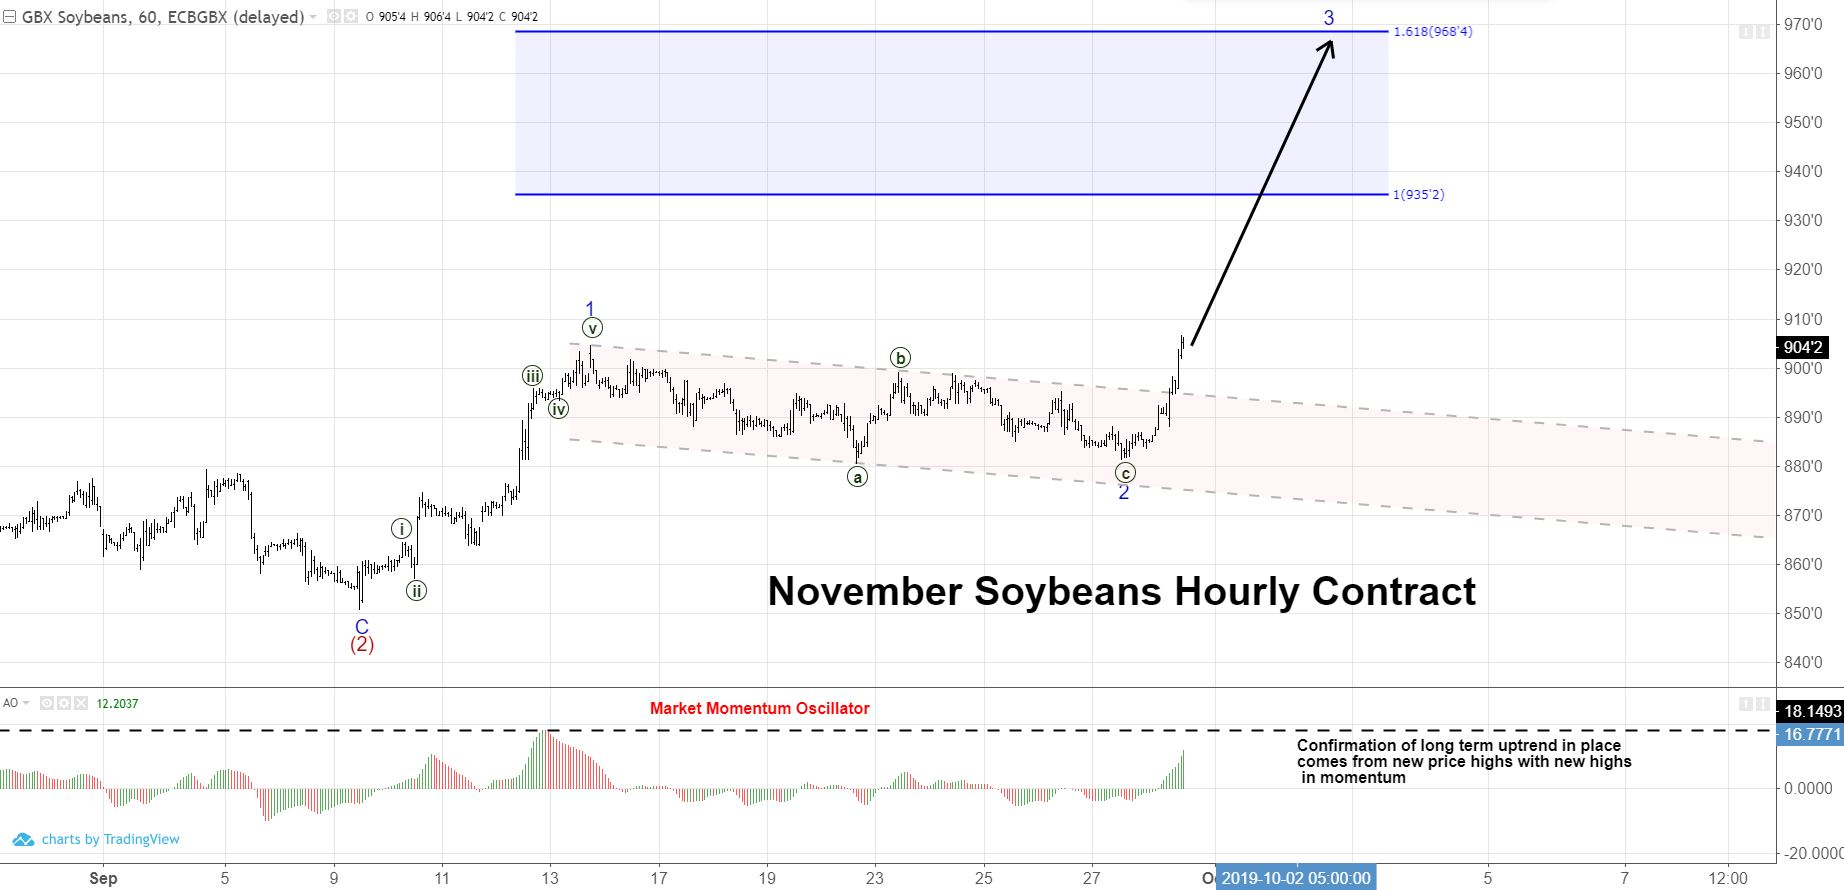
Soybeans have broken above the corrective price channel defining wave 2 of (3). This should bring about the the sharp price increases of a wave 3 of (3). Confirmation will come from a few indicators (other than price). First, we should see momentum make a new high above the previous high in mid-September seen on the hourly chart.
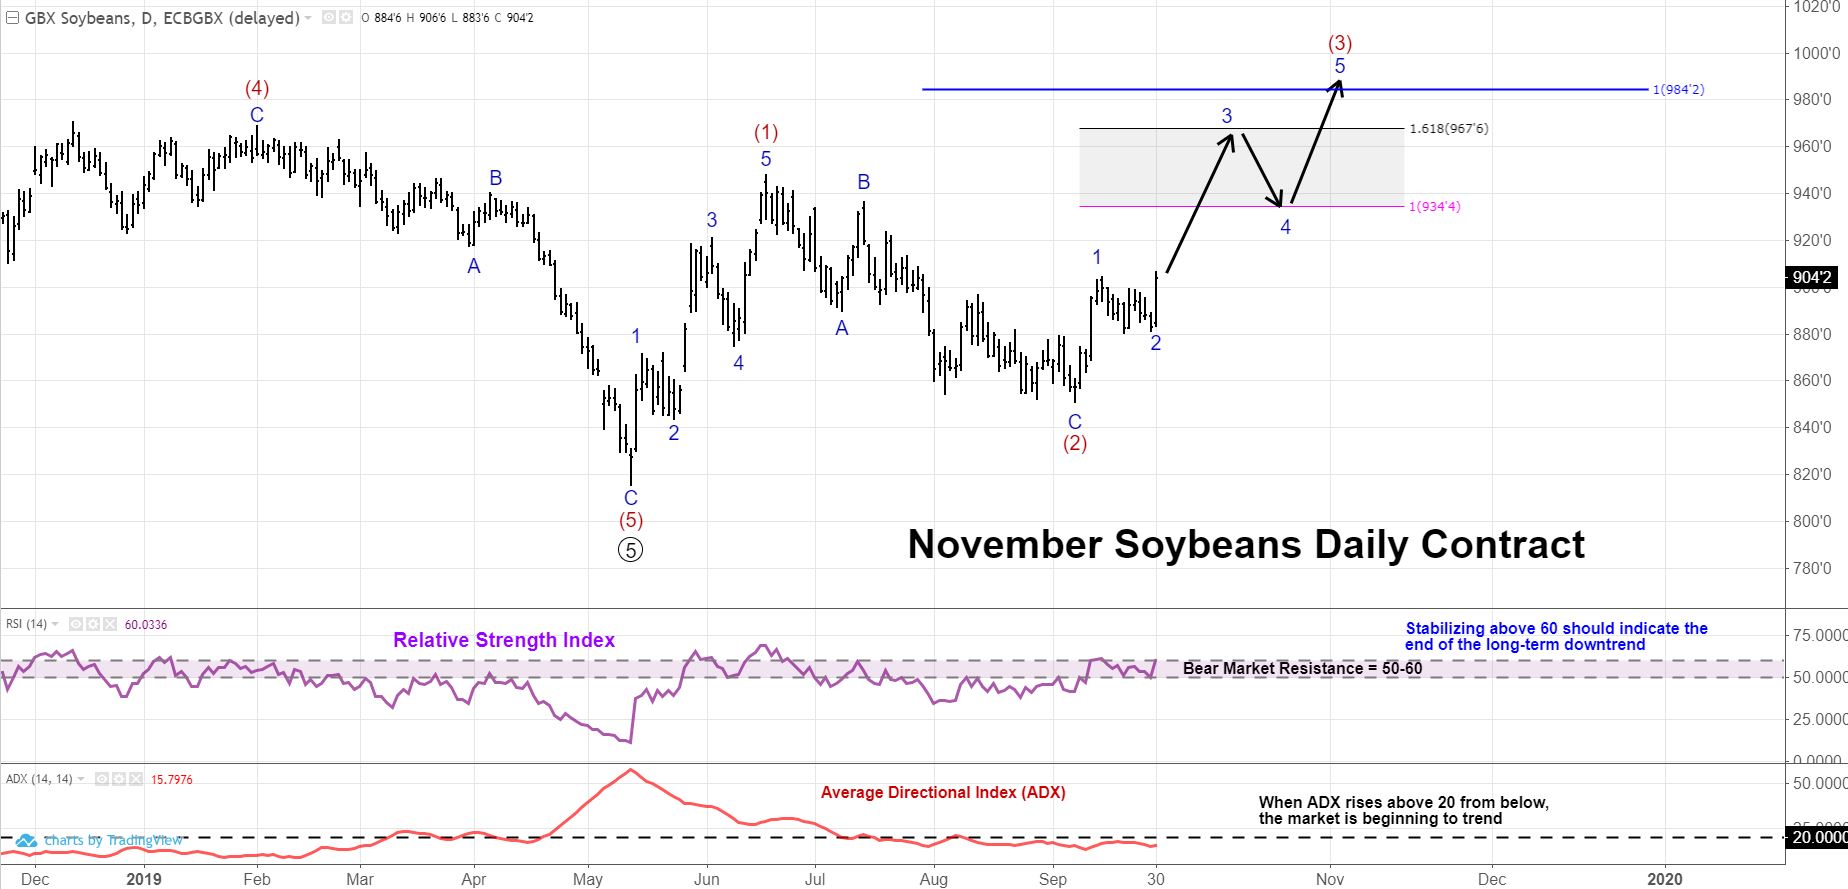
Other indicators to watch are the Relative Strength Index (RSI) and the Average Directional Index (ADX). See daily chart below.
RSI (currently at 60) has reached the top of bear market resistance. To explain, when a market is in a long-term bear market, counter-trend rallies in price will typically see RSI move higher but stay below the 50-60 level. If RSI moves above and stabilizes, it is often an indication the longer-term bear trend is over and market participants can focus on the upside. In the coming week, watching what RSI does on a daily chart may give clues/confirmation of the uptrend.
The average directional index is an indicator that tracks how much a market is trending. A big tell is when the ADX spends a lot of time below the 20 level and then rises above 20. This is usually an indication that a market is starting to trend. If recent price action is the start of a trend, we can expect much higher prices in the coming weeks/months. This is something a buyer would want to stay ahead of.
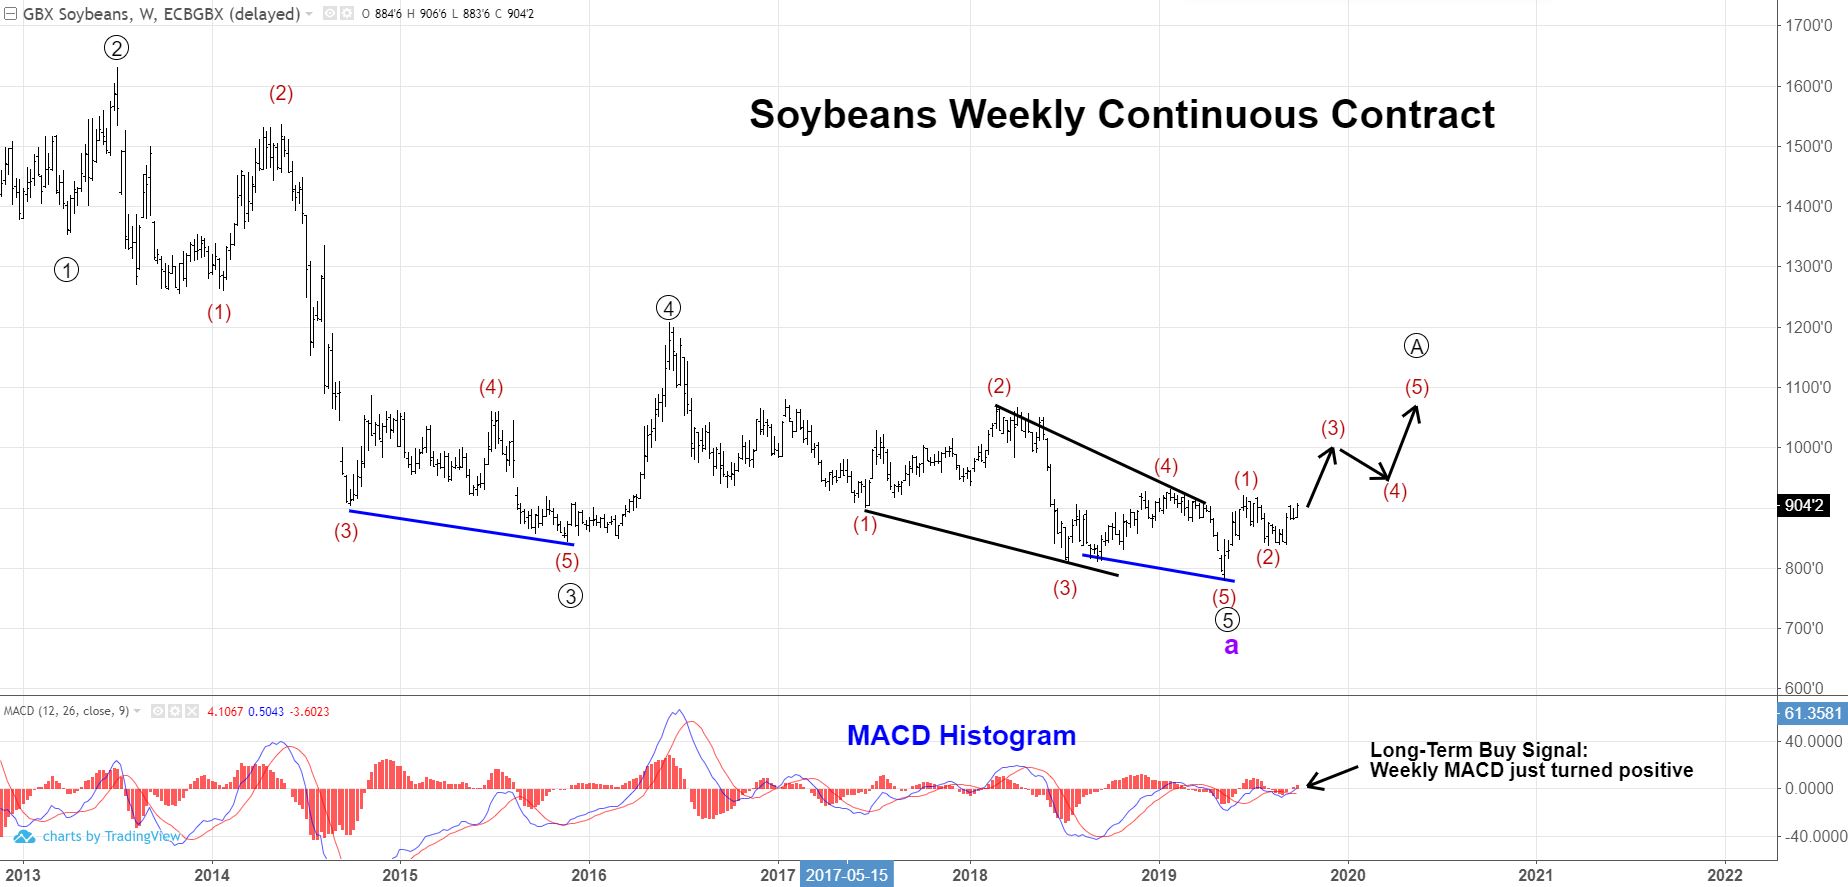
Taking a longer term perspective, we look at the weekly chart. There are a couple of things to note. First, the MACD has turned positive presenting a “buy” signal on long-term charts. Wave 5-circled is an ending diagonal pattern. Ending diagonals are noteworthy because when they are complete, prices typically retrace all the ending diagonal’s price movement within a 1/3-1/2 the time it took to develop. To be more specific in this case, wave 5-circled started in mid-2016 at a price of $12/bushel. It declined until May 13th, 2019 down to $7.80. Because the ending diagonal took 3 years to play out, we can expect prices to get back up to $12/bushel within 1-1.5 years from May 13th. Don’t be surprised if Soybeans are above $12/bushel next summer!
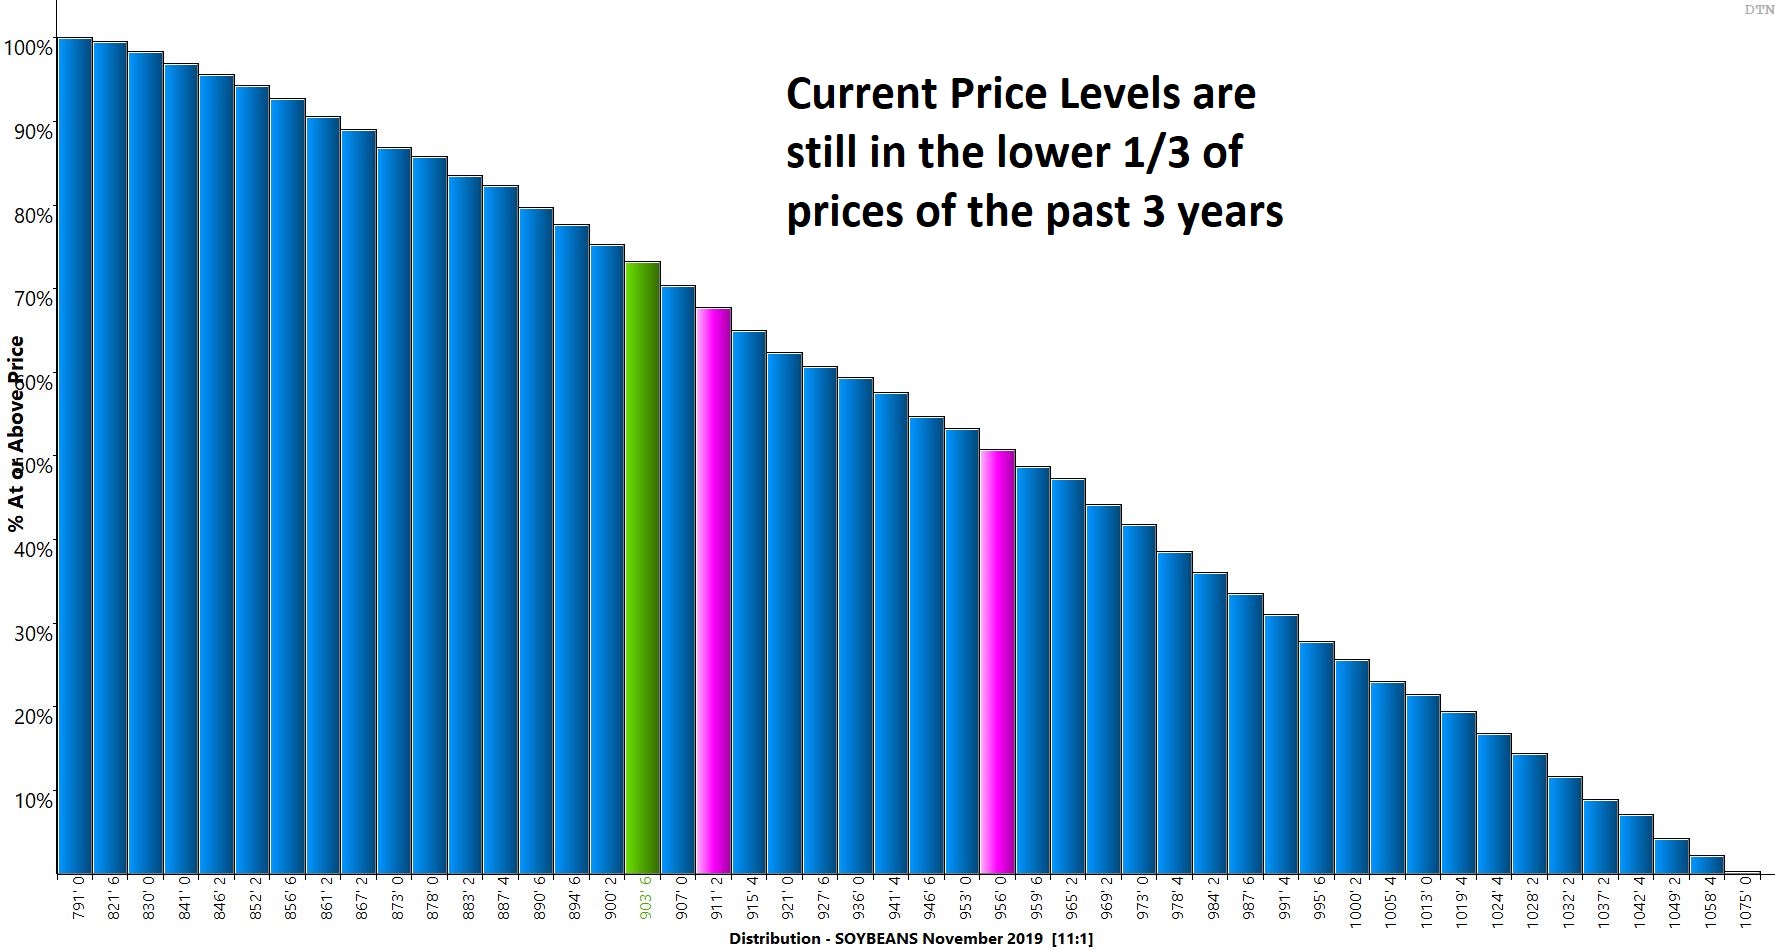
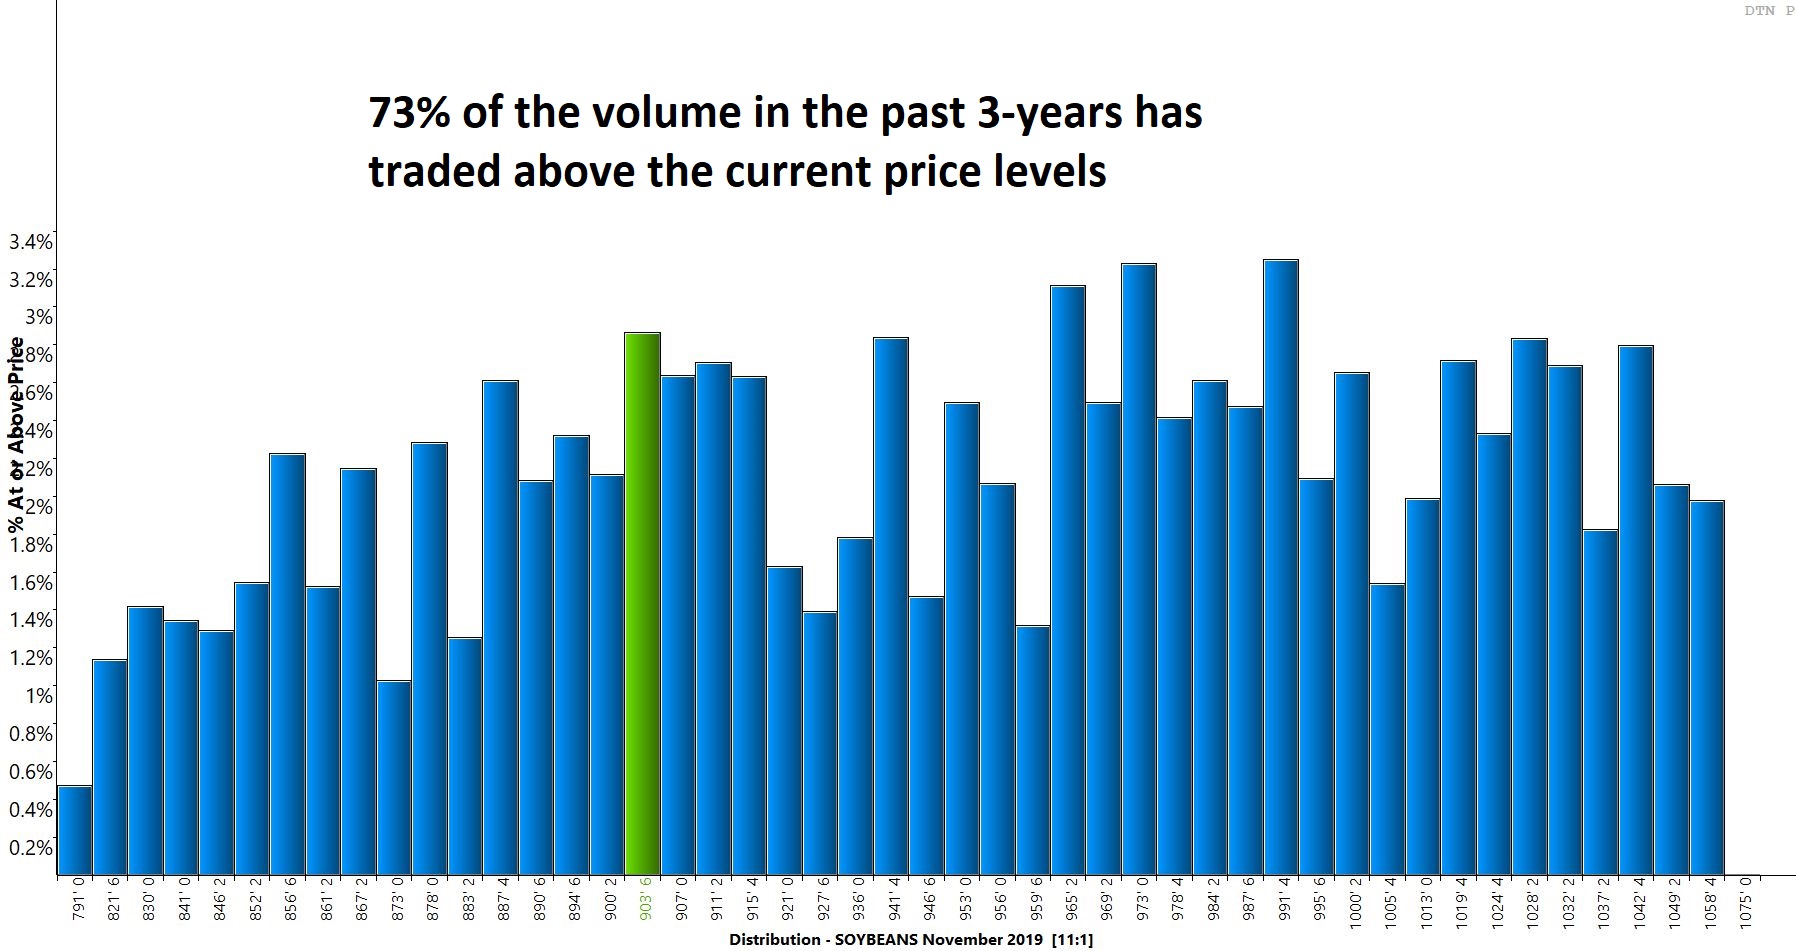
To add to a buyer’s confidence in pulling the trigger and adding coverage, not the distribution charts below. The price distribution chart shows that despite the recent rally, current price levels are still in the lower one-third of the price range in the past 3 years. To purchase in the lower 1/3 of a price range should be a goal for every buyer. Looking at the volume distribution chart, we can see that 73% of all the volume in the past 3 years has traded at levels higher than you can currently purchase. That should help in knowing you most likely extending coverage at levels better than the competition.
Quick Recap of Monday’s USDA Quarterly Stocks Report
USDA on Monday reported quarterly stocks on September 1st for corn at 2.11 billion bushels and soybeans at 911 million bushels, both coming in lower than the average pre-report estimate by traders.
USDA said soybean stocks as of September 1st totaled 913 mb. That’s up 108% from last year, but below the range of pre-report expectations. Traders had expected USDA’s estimate to fall within 940 mb and 1.001 bb.
On-farm stocks totaled 265 mb, up 162% from last year, while stocks in off-farm locations totaled 648 mb.
Disappearance for the June to August time frame totaled 870 mb, up 11% from the same period a year prior.
USDA revised 2018 production down by 116 mb from its previous estimate, with planted area declining to 89.2 million acres (ma)and harvested acreage dropping to 87.6 ma. The national average yield estimate was revised down 1 bushel per acre (bpa) to 50.6 bpa.
Monday’s Grain Stocks report was bullish for corn and soybeans, neutral for wheat.