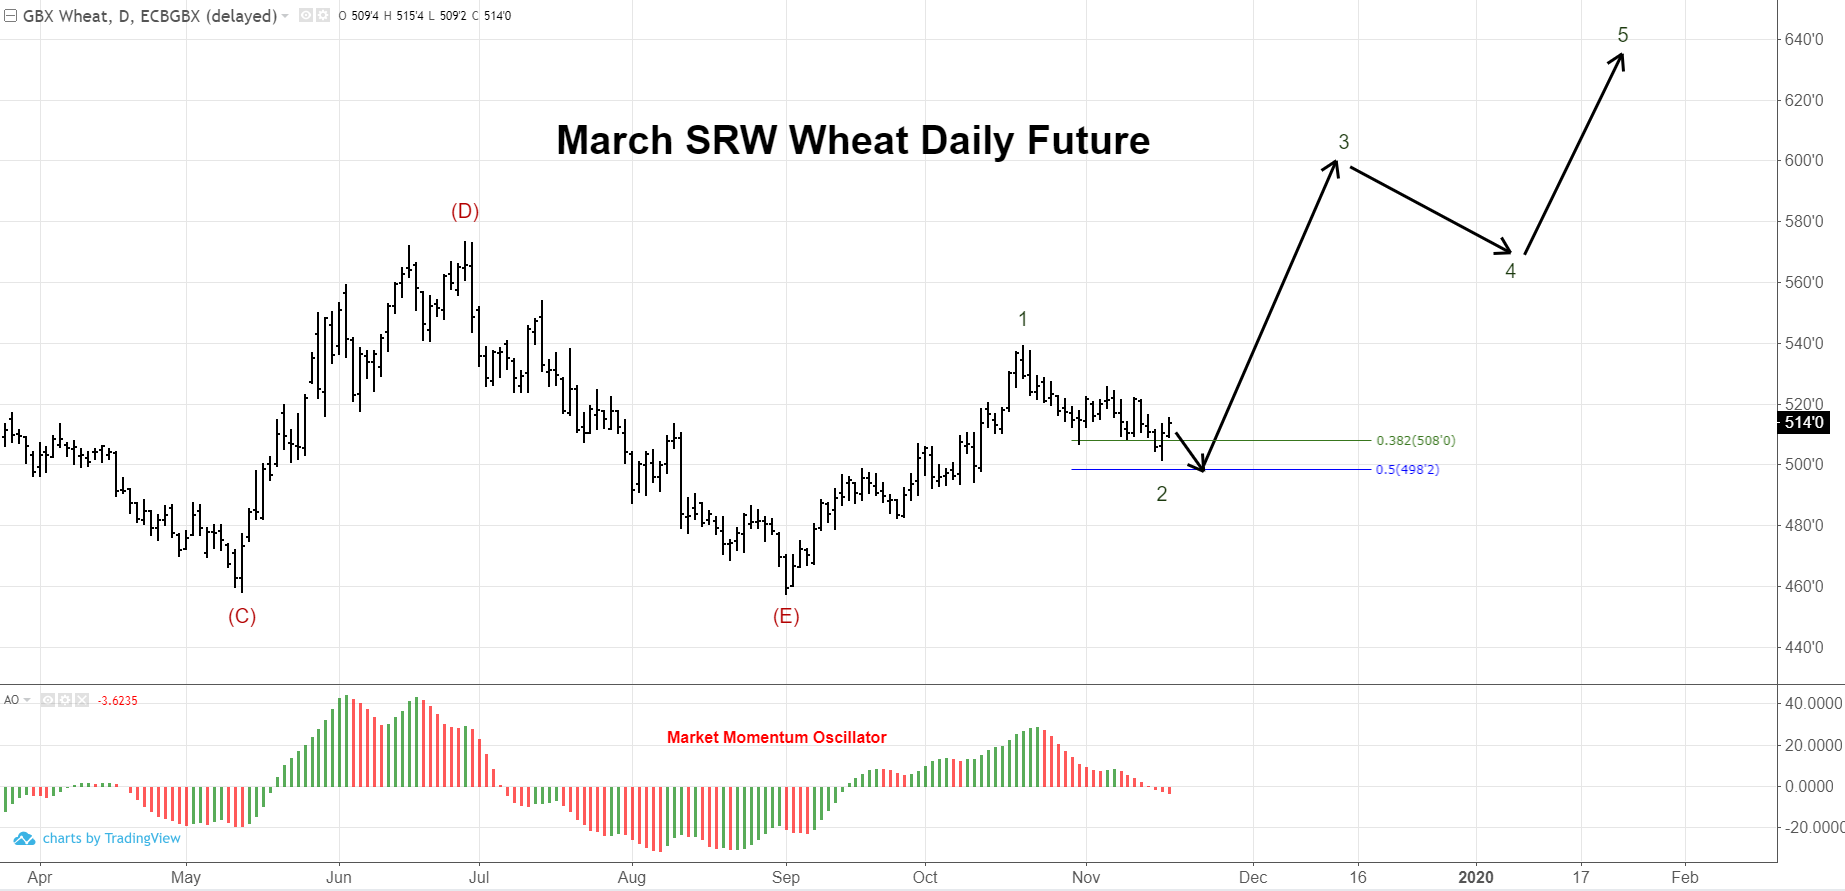
The daily chart for March Wheat is shown with the intermediate term forecast. This chart has a momentum signature for the forecast. We experienced divergence in price and momentum in August and early September (lower lows in price on weaker momentum each time). Then, momentum went positive to peak at the end of wave 1, followed by a reversion to the zero line. The return to the zero line is often the sign of the completion of wave 2. Ideally, we make a full 50% retracement of wave 1; however, the 38.2% retracement is sufficient.
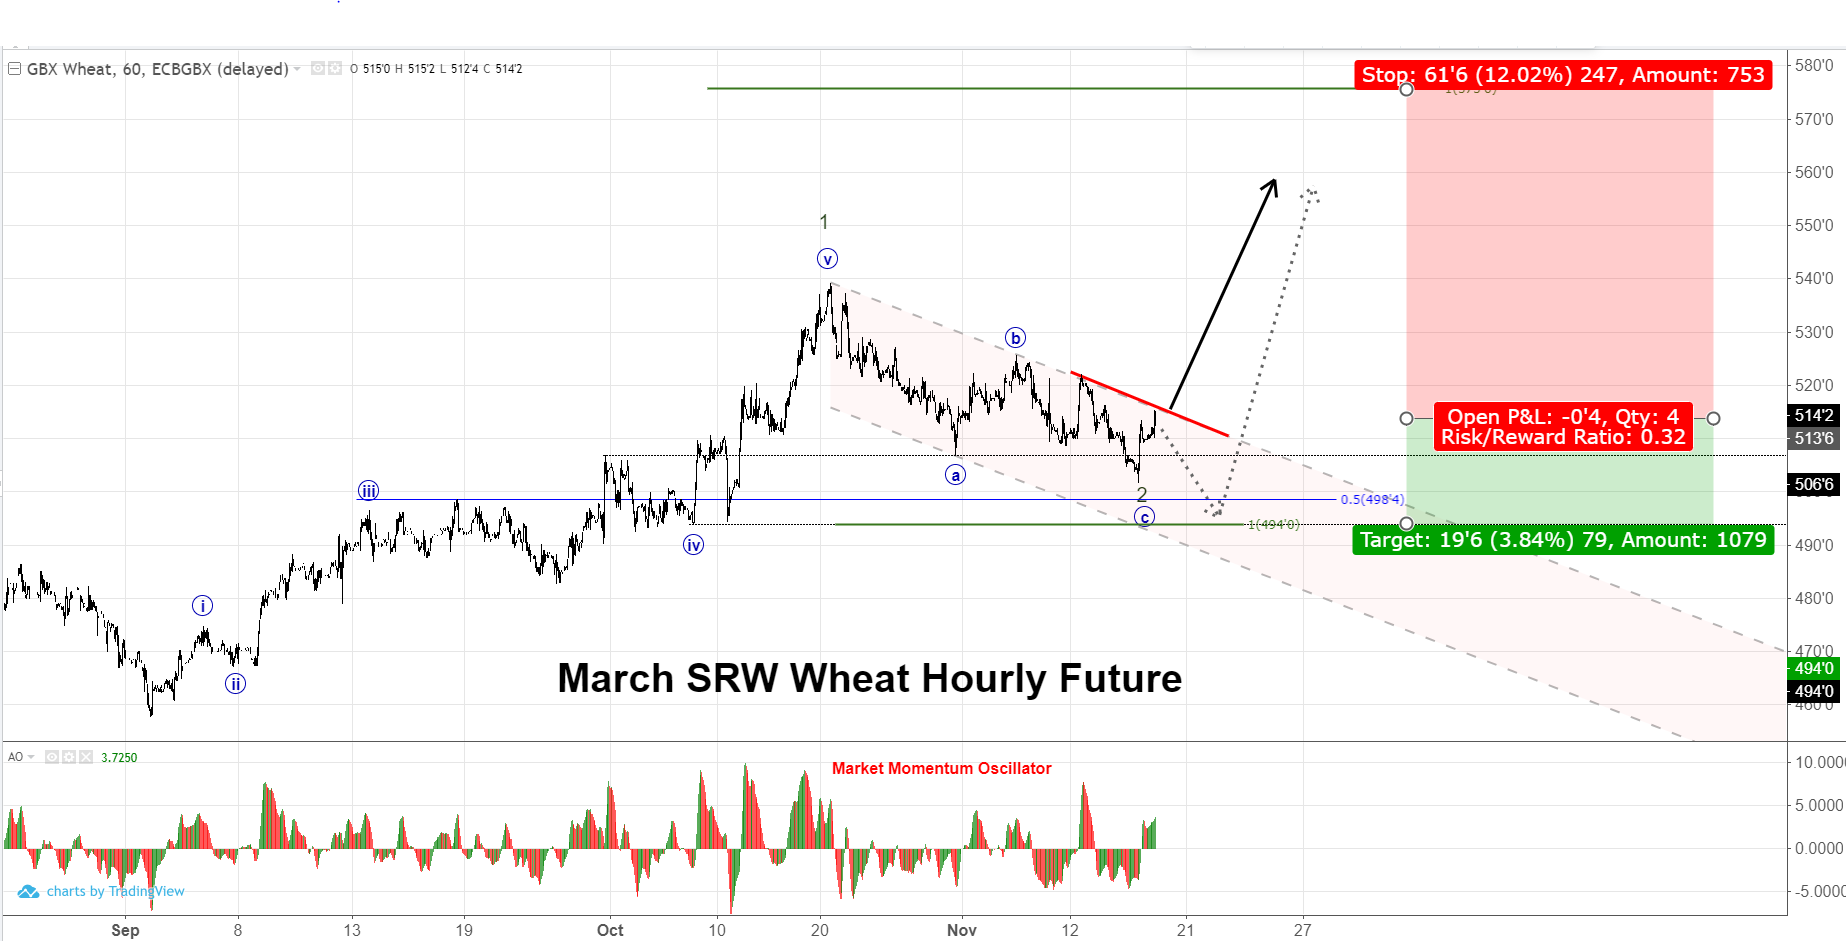
Zooming into an hourly chart we can see the substructure. Confidence will build with this forecast with multiple closing prices above the upper boundary of the corrective price channel (marked in red). This market could make a new low. The 50% retracement line or the low may be in place as shown with dotted arrows. However, if you are inherently short the market as a buyer, and you compare/contrast the reward of waiting to buy it at the 50% retracement with risk of this market breaking out to fulfill the forecast, it makes no sense to wait. You would be risking $3 to make $1. You don’t have to buy a casino owner in Las Vegas to know that is a bad bet.
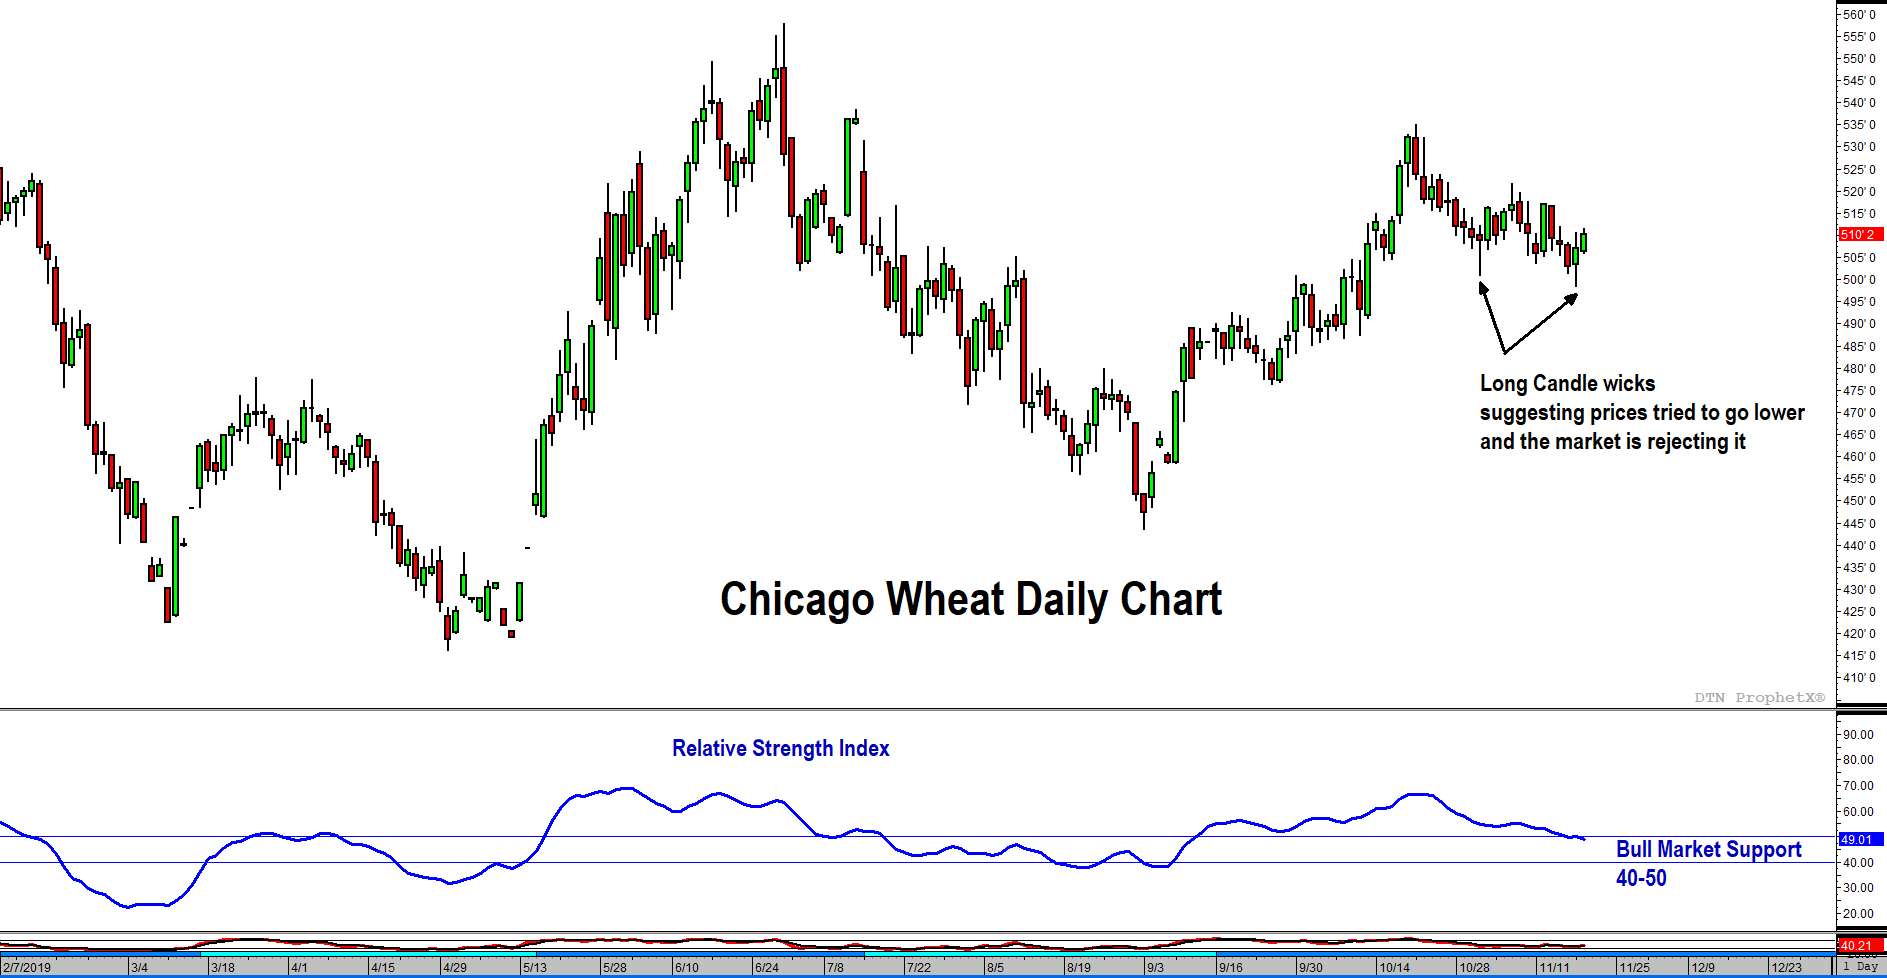
Further Technical Evidence Can Be Seen Below:
- Long wicks on recent candles illustrates that prices tried to go lower, but the market rejected that idea—a bullish trait.
- The Relative Strength Index stayed above the bull market support area (40-50) on the recent pullback. Staying above 40 is a sign that the overall uptrend is still intact.
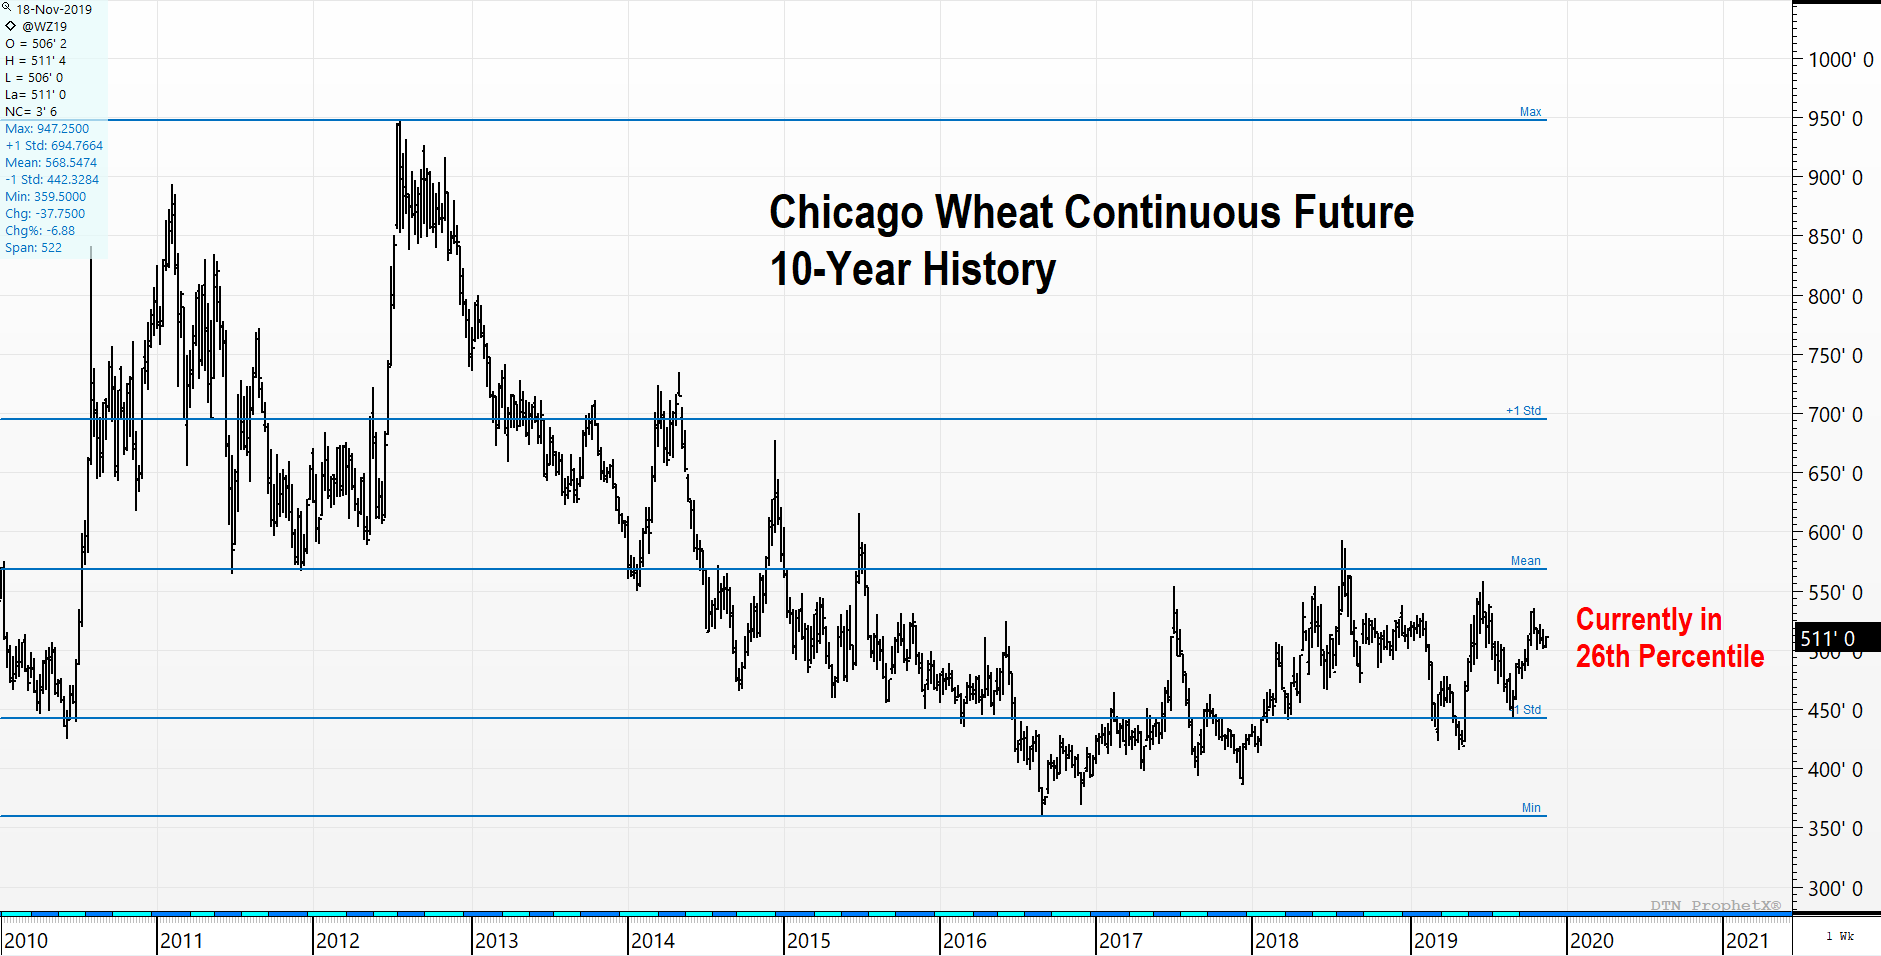
If you need further evidence to light a fire, look at a 10-year history chart with some statistics. Current prices are well below the mean value and in the 26th percentile of all prices during that time frame…a buy for procurement.
For buyers with a need for higher protein, the call to buy is even more pronounced! On a historical scale, KC and MPLS Wheat are extremely cheap compared to Chicago Wheat…an added benefit.
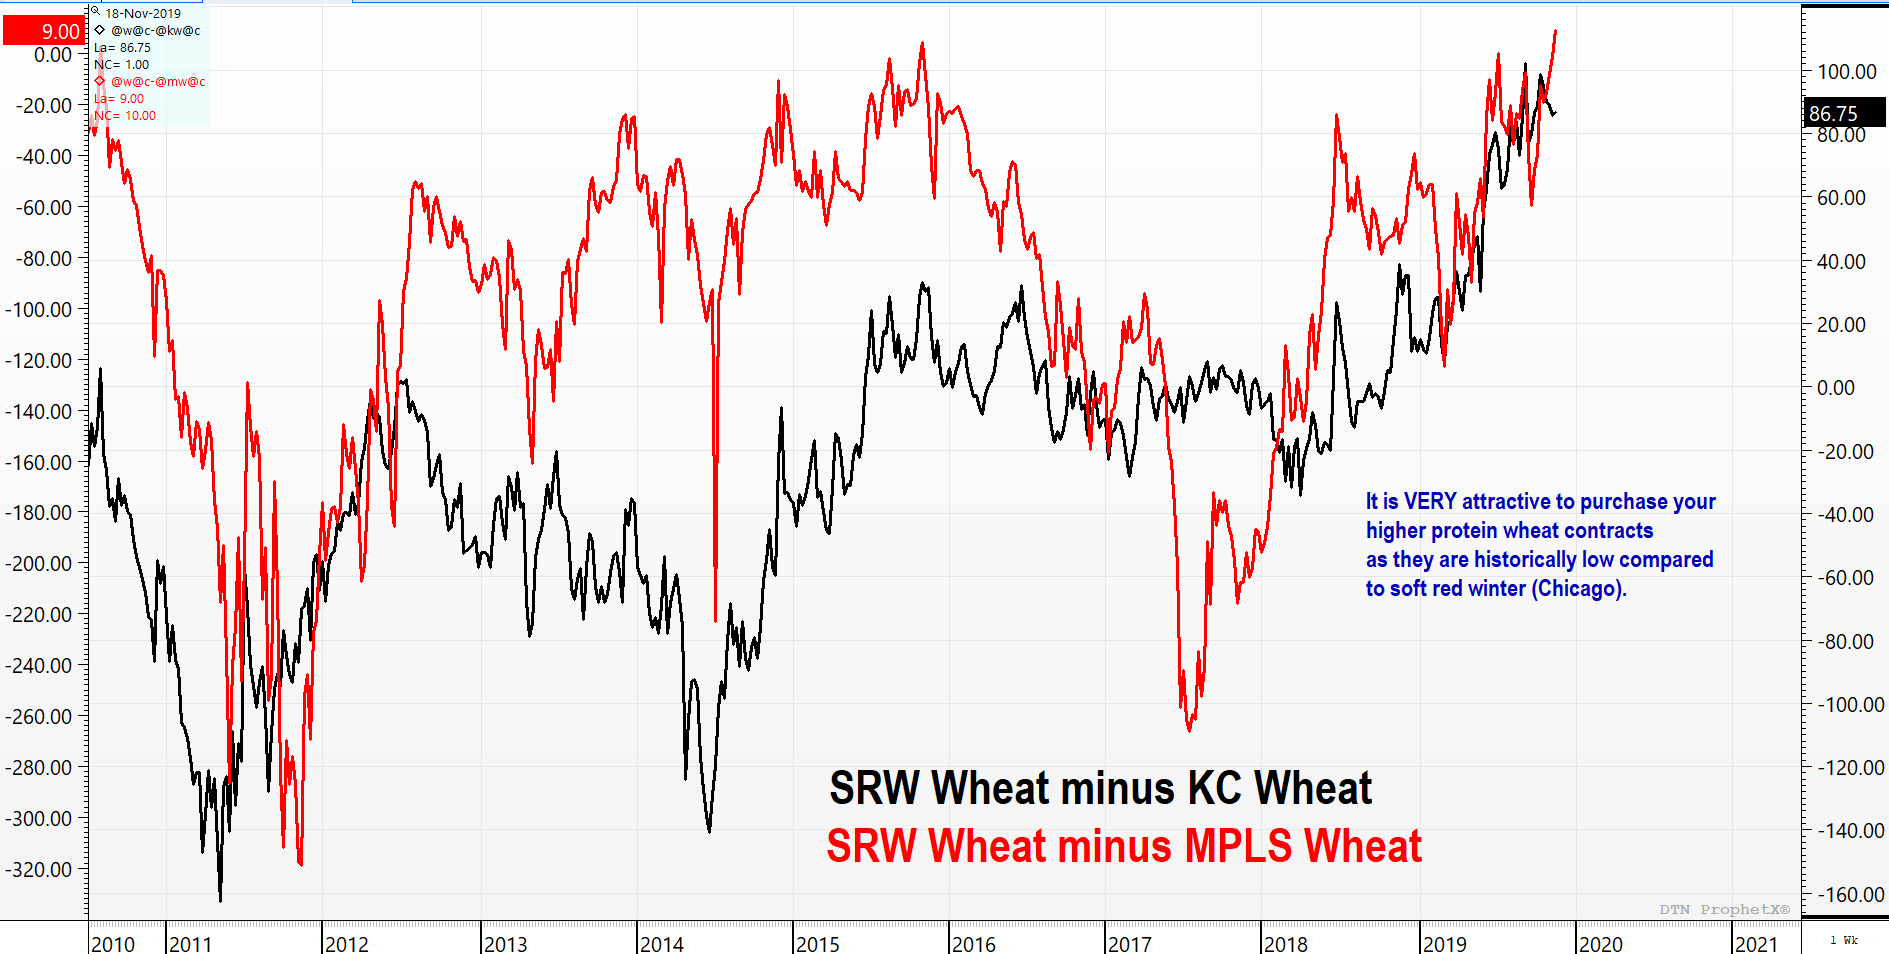
Chicago Wheat Fundamental Information:
- What stands out about the performance of the MW/W inter-market spread is the fact spring wheat basis remains strong. On Monday, the Minneapolis spot floor closed 14.0-15.0% protein between +180 and +215 over the December board.
- Yet, Minneapolis calendar spreads continue to trade at much higher percentages of full carry than either Kansas City or Chicago. High quality wheat is retaining a premium in the cash market, but the threat of receiving off-grade wheat from delivery stocks in Duluth and Minneapolis remains a threat, and therefore keeps the front-end of the spring wheat curve weak.
- Wheat conditions on the crop progress report took a hit, with good-to-excellent readings falling to 52% — down 2 percentage points, and compared to 56% last year. Some key hard red winter (HRW) states dropped sharply, with Oklahoma down 11 points (and down 24 in the last two weeks), Texas down 6, Kansas down 4 and Colorado down 7 percentage points. Arkansas dropped 9 points. Dryness in the Southern Plains is no doubt the reason.
- Cumulative exports are up 21.4% from a year ago while the USDA is calling for a 1.4% increase.
- The Russian Ag Ministry estimates that as of Nov 14, they had harvested 77.9 million metric tons (mmt) of wheat. That is even higher than the 75.6 mmt estimate from USDA in the November report, and compares to 73.4 mmt last year.