Although improved weather forecasts and poor demand from a slowing Chinese economy that is in a trade war have soybean prices retreating, now is the time to buy. A summary of today’s fundamental information is at the end of this post.
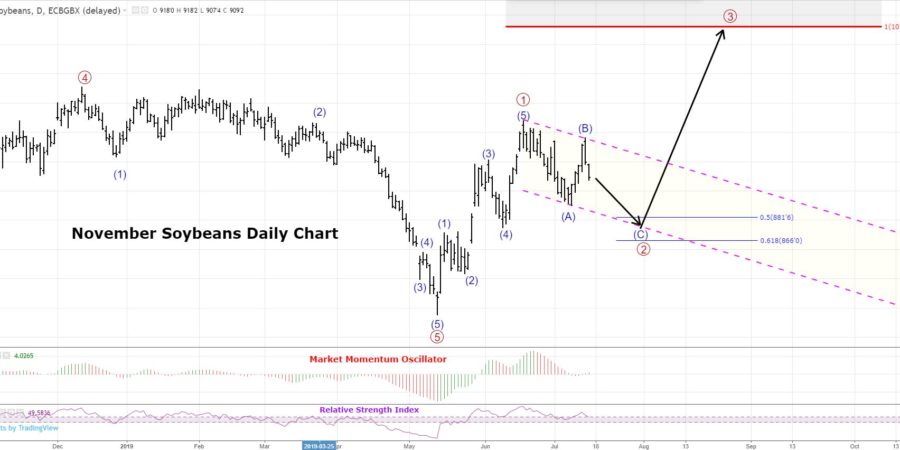
The first chart below is from a technical analysis perspective and gives a forecast for price. Expectations are for a small downside move in wave (C) of 2 back to the 50%-62% retracement lines (in blue), also testing the lower boundary line of the pink, dotted price channel. At that point, the forecast is for much higher prices in wave 3. Initial target is $10.12/bushel with $10.90/bushel a likely scenario too.
Supportive evidence includes RSI staying above the bull market support levels of 40-50. The momentum signature also looks good.
From a trader’s perspective, this forecast becomes in doubt if we have multiple closes below $8.66 or below the pink, dotted price channel. These scenarios would put into question the current wave count’s structure.
Confidence in this forecast can be gained if we settle above the pink, dotted channel and then become emboldened if the make a new price high on increasing momentum.

The Soybean Buyer’s Procurement Prospective
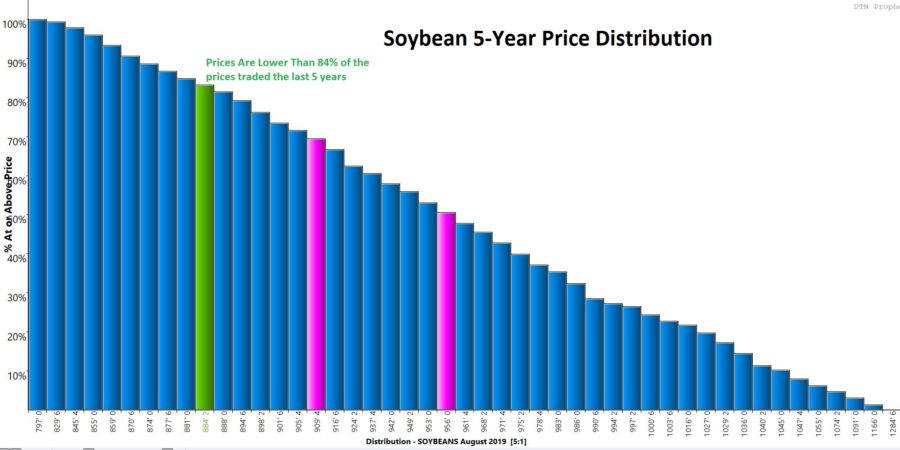
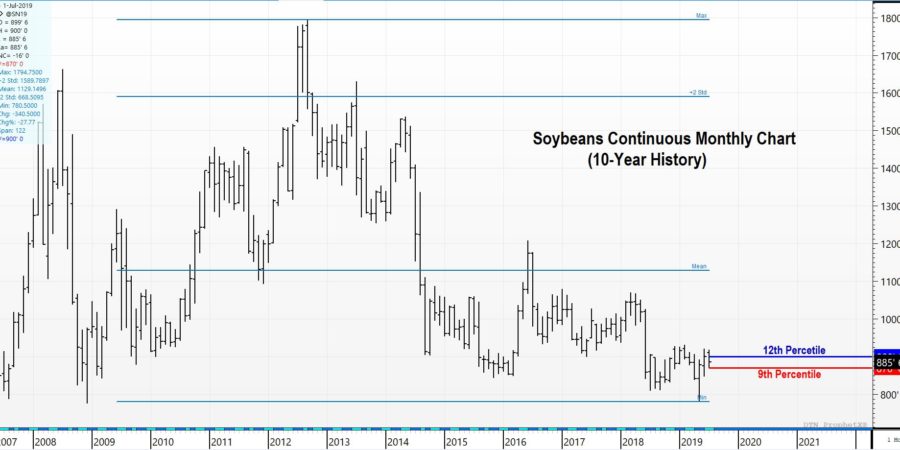
From a buyer’s perspective, one should not be so concerned if he/she buys soybeans at these levels and prices falter. Looking at the last two charts we have a 10-year price history of Soybean futures with statistics and a 5-year price distribution of soybean futures.
The 10-year chart shows that if you purchase soybeans between $8.70-$9.00, you are procuring beans between the 9th-12th percentiles of the last 10 years. That should almost always be a buy.
The 5-year chart shows that 84% of prices traded in the last 5 years have been at higher levels than current values. That also should allow a buyer to lock in soybean prices, and sleep like a baby.

The last thing to think about as a buyer is this: if I purchase bean here and I am wrong, I will then have even lower prices next purchase.
In Summary for a Soybean buyer:
- The current forecast is for much higher prices.
- Current price levels are near the 10th percentile of the last 10 years and the 16th percentile of the last 5 years.
- If one takes risk off the table by purchasing here, and these favorable odds do not work out for you, that means that 2020 prices will be even cheaper. It’s a good situation to be in where you can go into your budget committee meeting and let them know either you made a great procurement purchase now, or 2020 will be cheaper than 2019.
Today’s Fundamental Recap:
Soybean prices are lower as traders reconfigure an improved weather forecast along with slowing economic growth out of China and disappointing demand figures.
- NOPA member crush released on Monday showed member-crush at 148.8 mb vs. the average trade guess of 154.4 mb and 159.2 mb a year ago. This was the lowest monthly crush total for any month going all the way back to September 2017.
- Even with the USDA recently revising their 2018/19 marketing year forecast lower on the July WASDE, crush will have to tie last year’s records to achieve it, something that looks incredibly daunting at the moment.
- Most crush spreads have slipped back below $1.00 per bushel from spot through August 2020.
- Inspections were solid at 31.4 mb, better than the 29.1 mb needed to hit the USDA forecast. Cumulative exports of 1.422 bb are down 24.1% from a year ago, but the concerning figure remains the outstanding sales to China. At 210 mb, this category alone has the potential to add to ending stocks if these sales are rolled into 2019/20.
- National soybean conditions improved to 54% G/E vs. expectations for 53% G/E, 53% last week and 69% last year. Again, conditions saw solid improvement in the Eastern Corn Belt. 22% of the soybean crop is blooming vs. 49% average, pushing key pod-set and pod-fill well into August.
