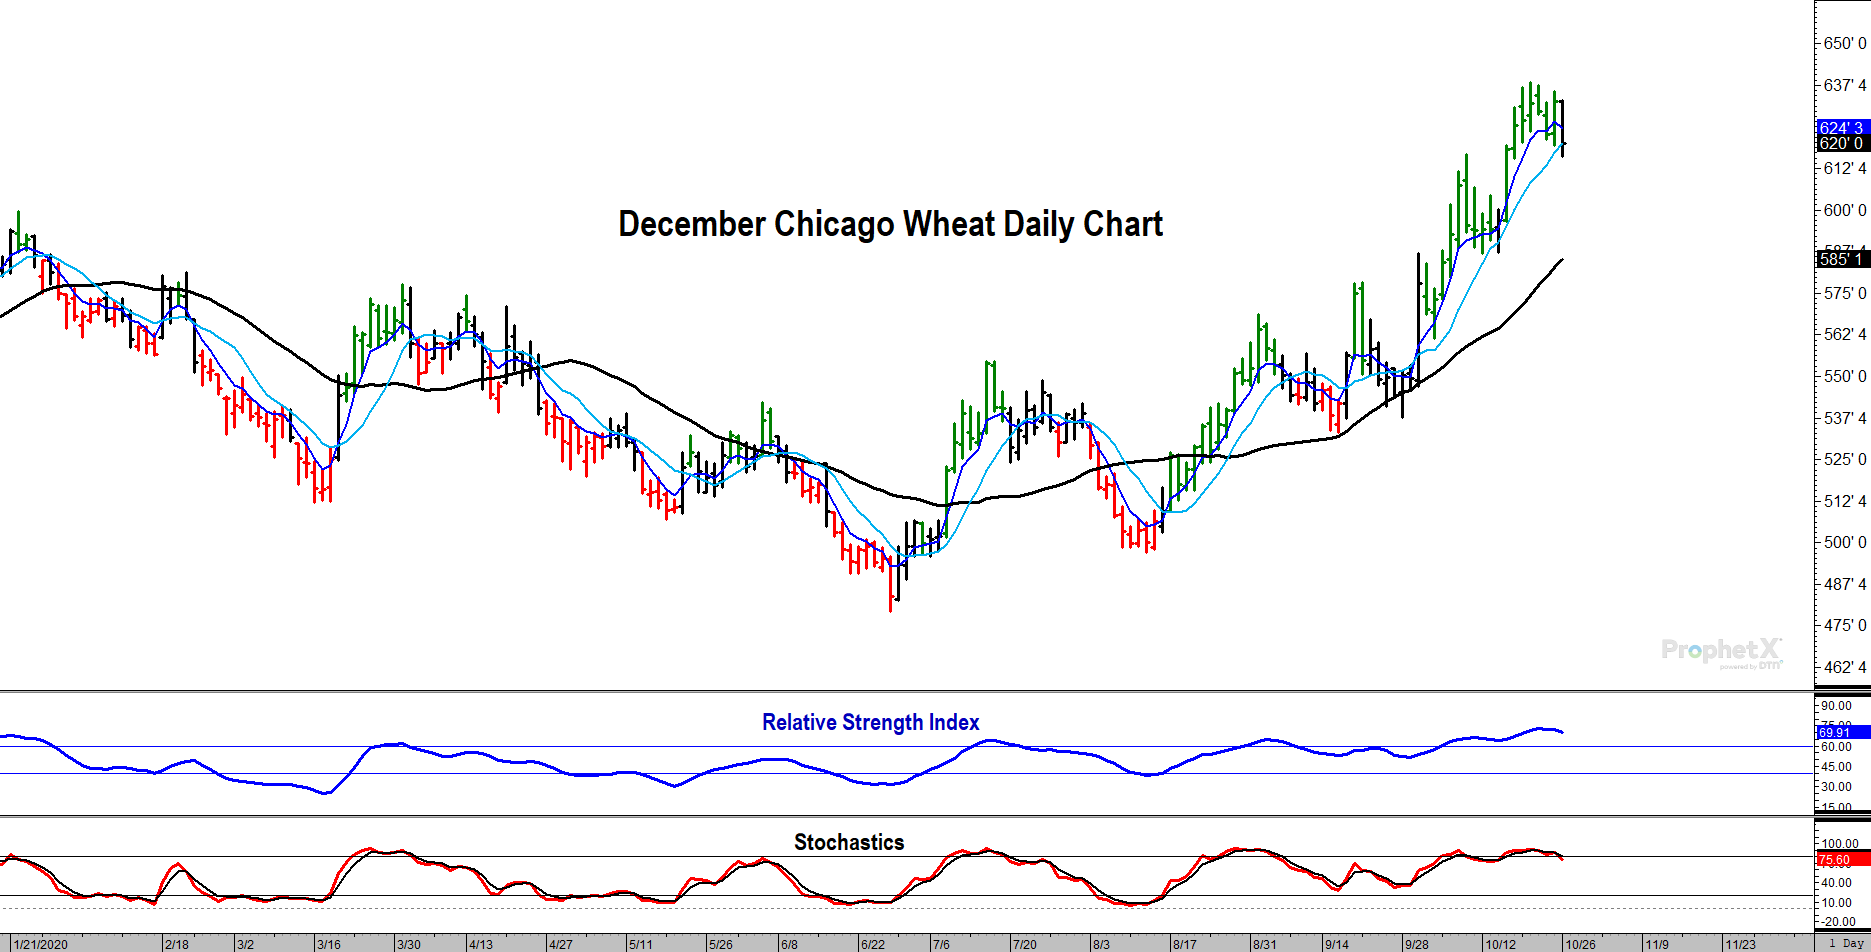
December Chicago Wheat continues to trend higher with accompanying momentum, suggesting more new highs to come in the future. The trend is up and pullbacks should be seen as buying opportunities. Below is our analysis and forecast principled in Elliott Wave theory and supported and/or questioned using other traditional technical indicators.
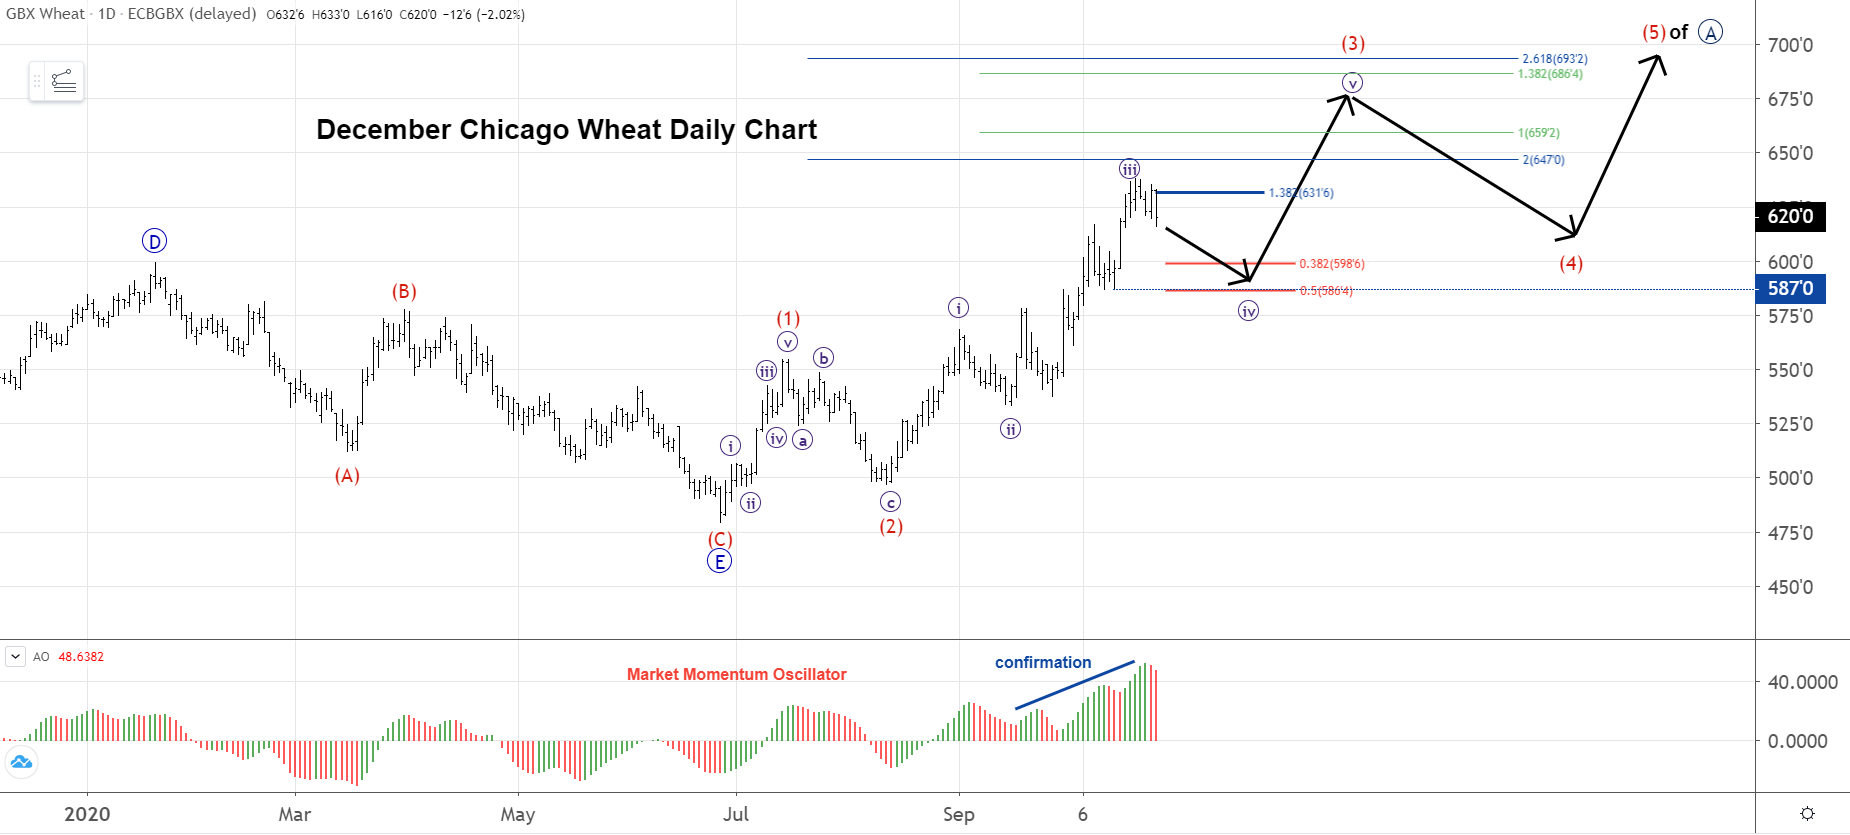
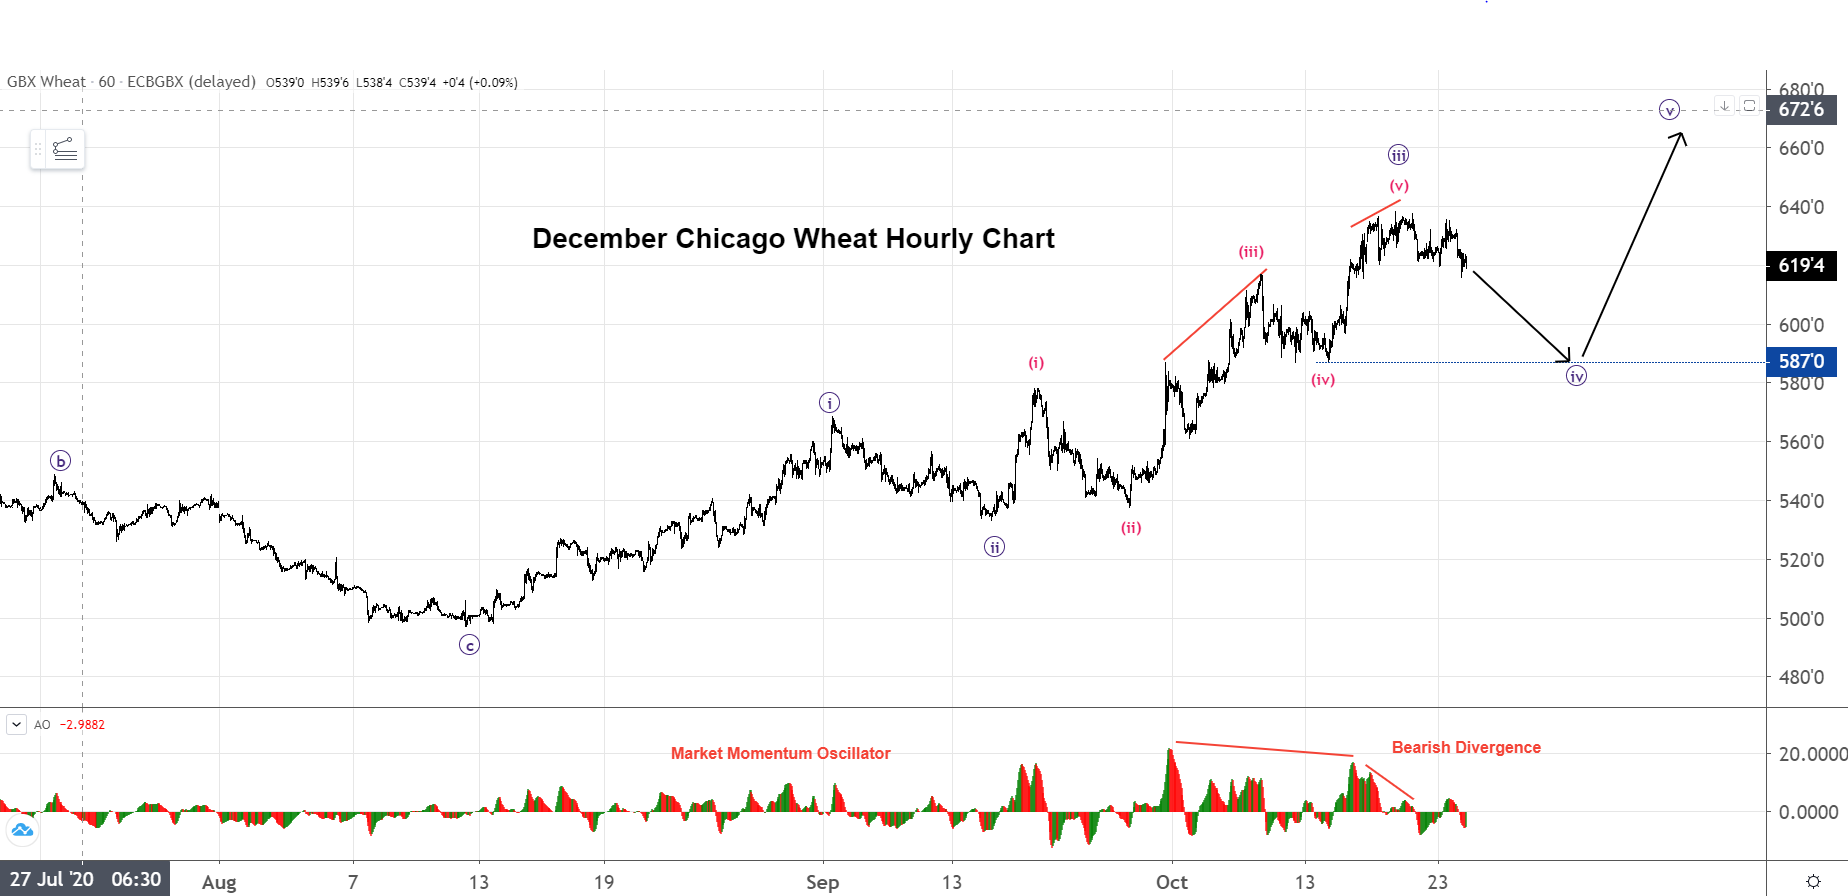
Although the uptrend is strong and accompanied by the highest momentum on the daily, we will not be surprised if this market experiences a pullback lower in the coming days. Our forecast suggests that this pullback will be a corrective wave ((iv)) within larger wave (3). All the requirements for a completed wave ((iii)) have been met and characteristics of third waves are showing with wave ((iii)) already reaching a 1.382 multiple of wave ((i)). We gain confidence in suggesting this as a possibility because the requirements have been met and the fact that the hourly chart is was screaming bearish divergence.
Given our outlook, the most probable path for prices is to pullback to the $5.85-$5.98 area in wave ((iv)). These are the 50% and 38% retracement levels of wave ((iii)). In fourth waves, 38% retracements are more common, but it should be noted that $5.87 is the terminus of the previous fourth of one lesser degree (guideline of depth of corrective waves), making $5.85 very probable.
Below is the hourly chart with noted subdivisions and a glaring double bearish divergence with momentum.
Other Forms Of Technical Analysis To Corroborate Or Refute Our Forecast
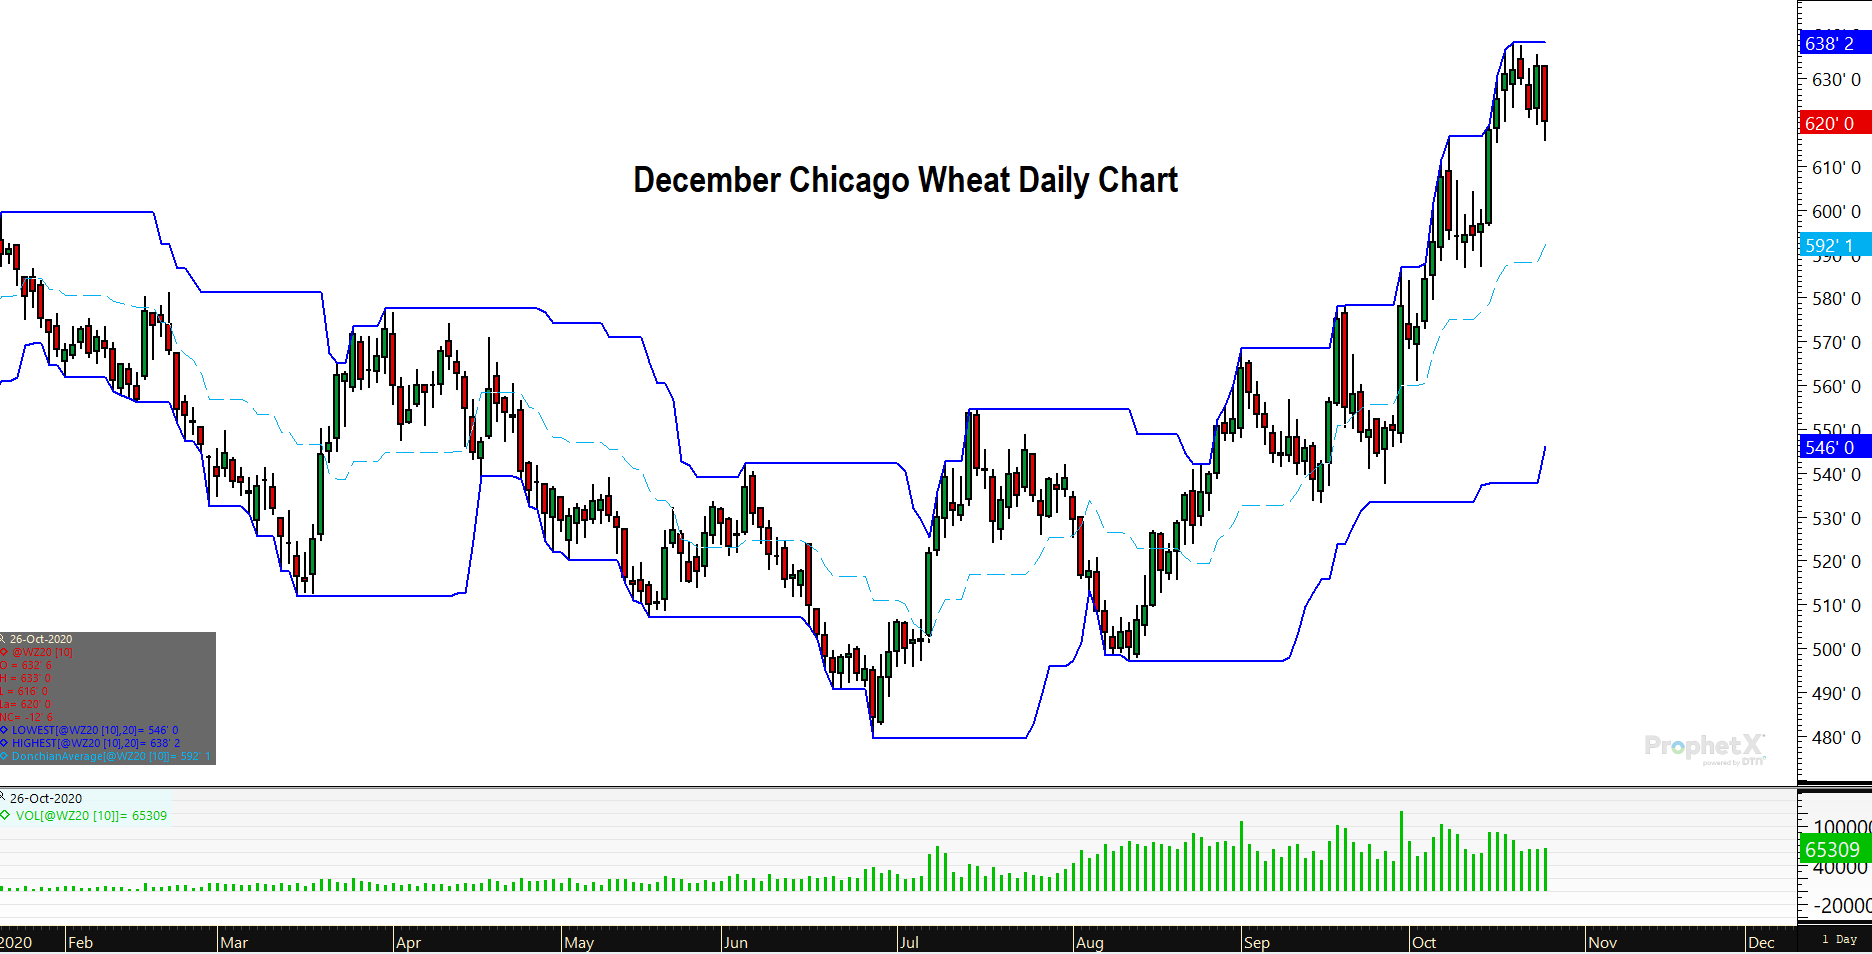
(Below) Monday’s candle is a bearish engulfing candle of the previous two days. This suggests that prices “should” go lower the next 3 to 5 trading days. Note: if we take out the high tomorrow, that would be a failed pattern and a bullish omen. Also, prices are in the upper half of the Donchian Channel, confirming the uptrend. Look for the midpoint of the channel to act as support on price pullbacks.
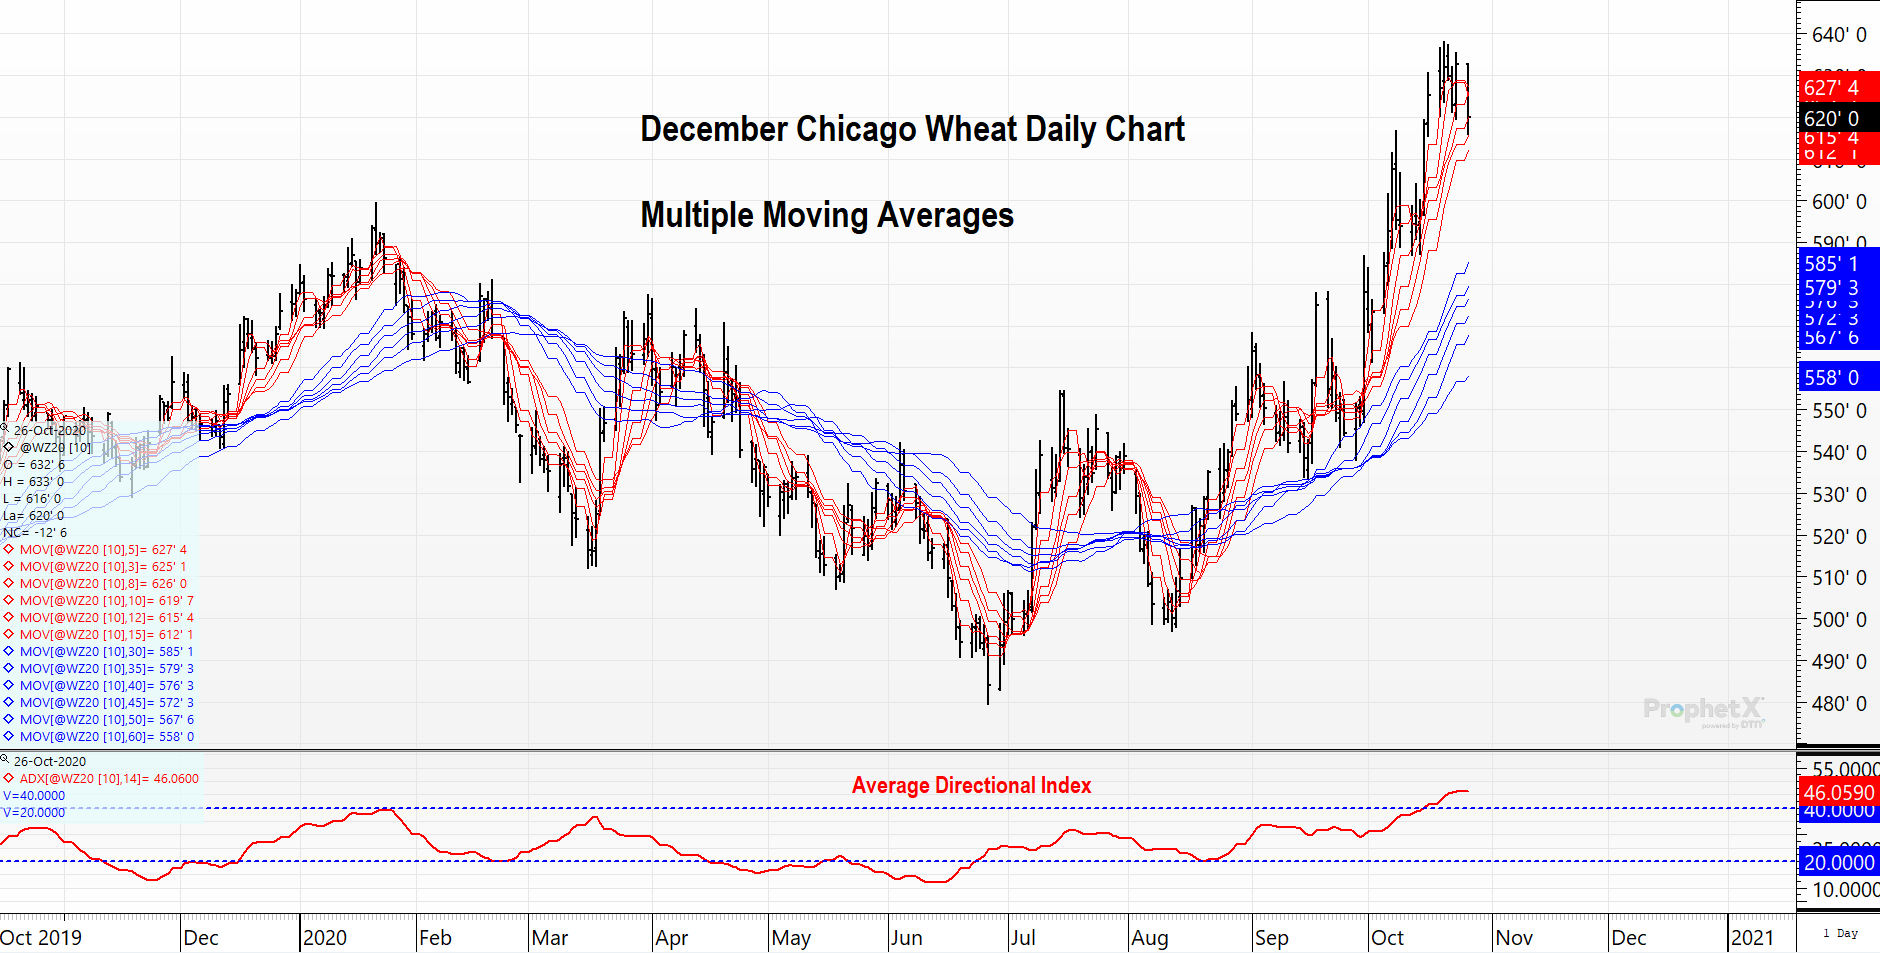
(Below) Both short and long term moving averages are sloped higher. ADX has confirmed the major trend. Look for price retracements into the long-term moving averages (50-day and 60-day) as buying opportunities.
(Below) RSI has conquered the 60-level, confirming the previous long-term down trend is on hiatus and the current trend is higher. Look for the 40-level in RSI to act as support during our forecasted wave ((iv)) pullback. Stochastics are in overbought territory, but that condition can last for a while. Divergence would add confidence.
Taking a long-term view, you can see the long-term trend is up as defined by the long term trend line and now positively sloped 200-period moving average.
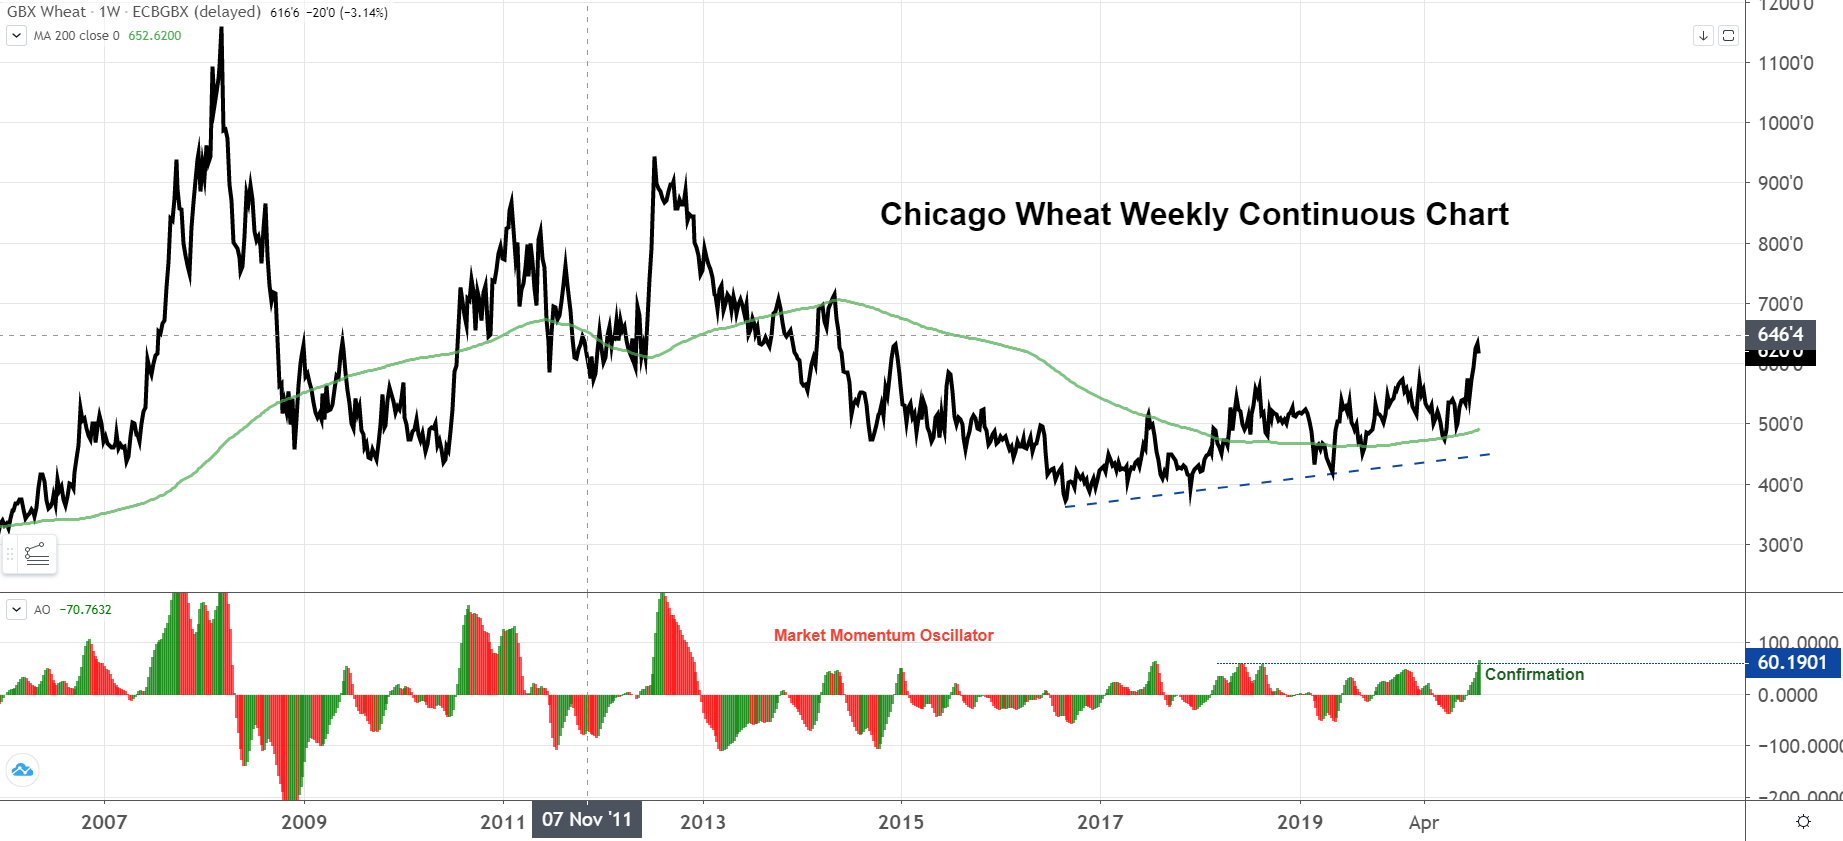
Buyer’s perspective: Long-term trend continues to be up. Our previous posts suggested that prices could target $6.80-$7.00. Although that seemed unlikely at the time to many doubters, the current situation makes that seem like a probable scenario. Pullbacks in this market should be seen as buying opportunities, especially if one does not have sufficient coverage. This will allow you to have patience and a strong hand if/when prices challenge $6.80-$7.00 and all news seems to be bullish.
A summary of the most pertinent fundamental information:
Chicago spot wheat late last week hit a 6-year high, as funds began to add to a net long in all three wheat markets.
Some analysts see the Chicago long at close to 70,000 contracts to begin the week. As of Tuesday, the CFTC shows the managed fund long in Chicago at close to 52,000 contracts.
Paris milling wheat futures are lower to begin on Monday. Black Sea wheat prices remain very stout, with Ukraine’s FOB prices up $7/mt last week to a hefty $255 to $258/mt on an FOB basis.
At the end of September, soils in the Southern District of Russia were the driest for the time of year since 2015 and 28% lighter than in the previous four years. The region is Russia’s top winter wheat producer, accounting for more than 40%. Forecasts suggest that this month will likely become one of the driest Octobers on record in the Southern District. Some analysts recently said planting in this area could fall up to 15%. Reports out last Friday said the USDA Ag Attache to Ukraine sees the country’s wheat crop 8% below latest USDA estimate.
Egypt’s tender for last part of December resulted in Russia selling 165,000 mt, and that is said to be at the highest FOB price in five years at $264/mt on average.
In addition to the drought in southern Russia, wheat bulls will continue to keep an eye on Australia, where heavy rains are in the forecast for Eastern and southeastern Aussie wheat areas, perhaps compromising quality there.
The presence of La Nina, the cool phase of the equatorial Pacific Ocean, could make things even worse for Kansas and its neighbors. That pattern, which will likely last into early 2021, often reduces winter precipitation across the Southern U.S. Plains.
The last La Nina event in 2017-18 created one of the driest growing seasons in history for winter wheat in Kansas, resulting in terrible yields.
Kansas is not the only parched U.S. wheat area, as parts of soft red winter wheat country, including Illinois and Indiana, are notably dry. Colorado, which also produces hard red winter wheat like Kansas, is amid one of its worst droughts on record.
In addition to expanding drought, a long freeze affects U.S. HRW wheat from late last week into early this week. Lows in the 0-10F are forecast for eastern CO and western KS, approaching all-time October record lows.
Dryness in Argentina is also a bullish driver, with the Rosario Exchange late last week dropping Argentine wheat production to just 17 mmt, which is 2 mmt lower than the October WASDE report estimate.
Wheat currently being sown in the Northern Hemisphere will be harvested in the 2021-22 cycle that does not start until later next year. But a supply cushion has been built up in the current year, as U.S. government outlooks show world ending stocks rising to an all-time high in 2020-21.