This post is a follow up from our July 14th post, Wheat Futures Technical Analysis.
Time To Buy Chicago Wheat Futures
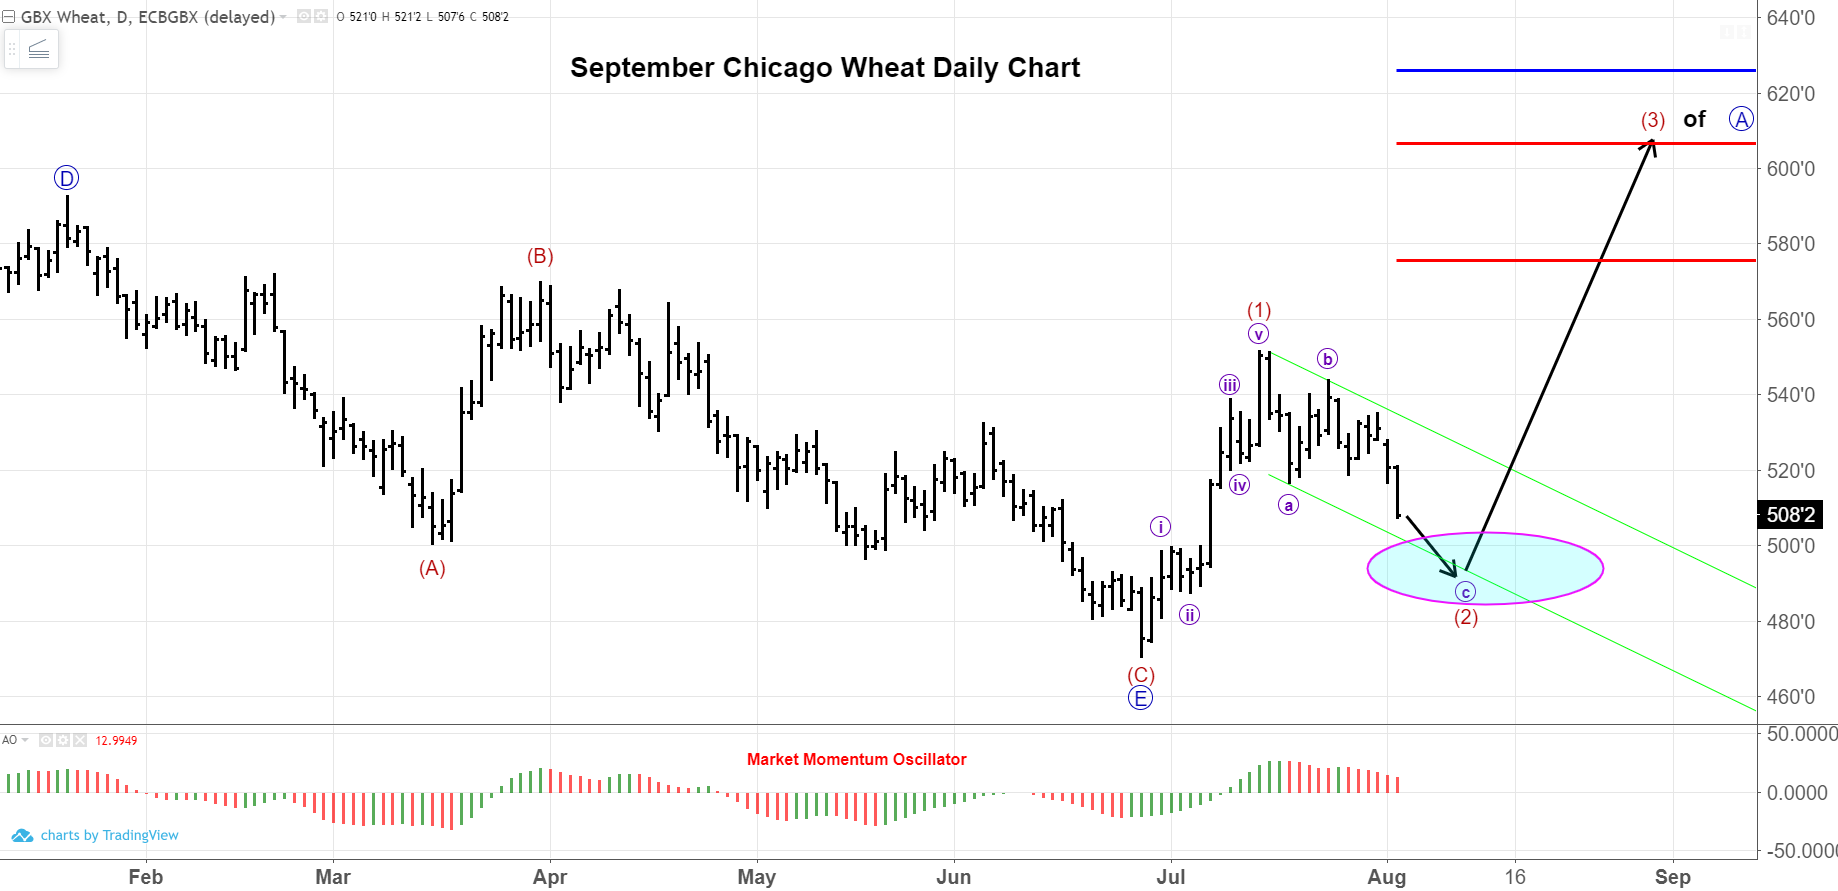
In the coming days or weeks, Chicago Wheat should provide an excellent opportunity to layer in long-term coverage. Our current, most probable wave interpretation is the following. Since the previous post, we have established wave (1) up and are currently in subwave © of (2) of a larger 5-wave structure. Look for wave © to zig-zag lower and challenge the lower boundary of the trendline and the $5.00 level (which is also a .618 retracement of the initial wave (1) rally). Once this wave (2) is complete, expectations are for an impulsive wave to take this market to much higher prices. Subsequent evidence, and what to look for, is in the following charts. A recap of the most pertinent fundamental information is at the end of this post.
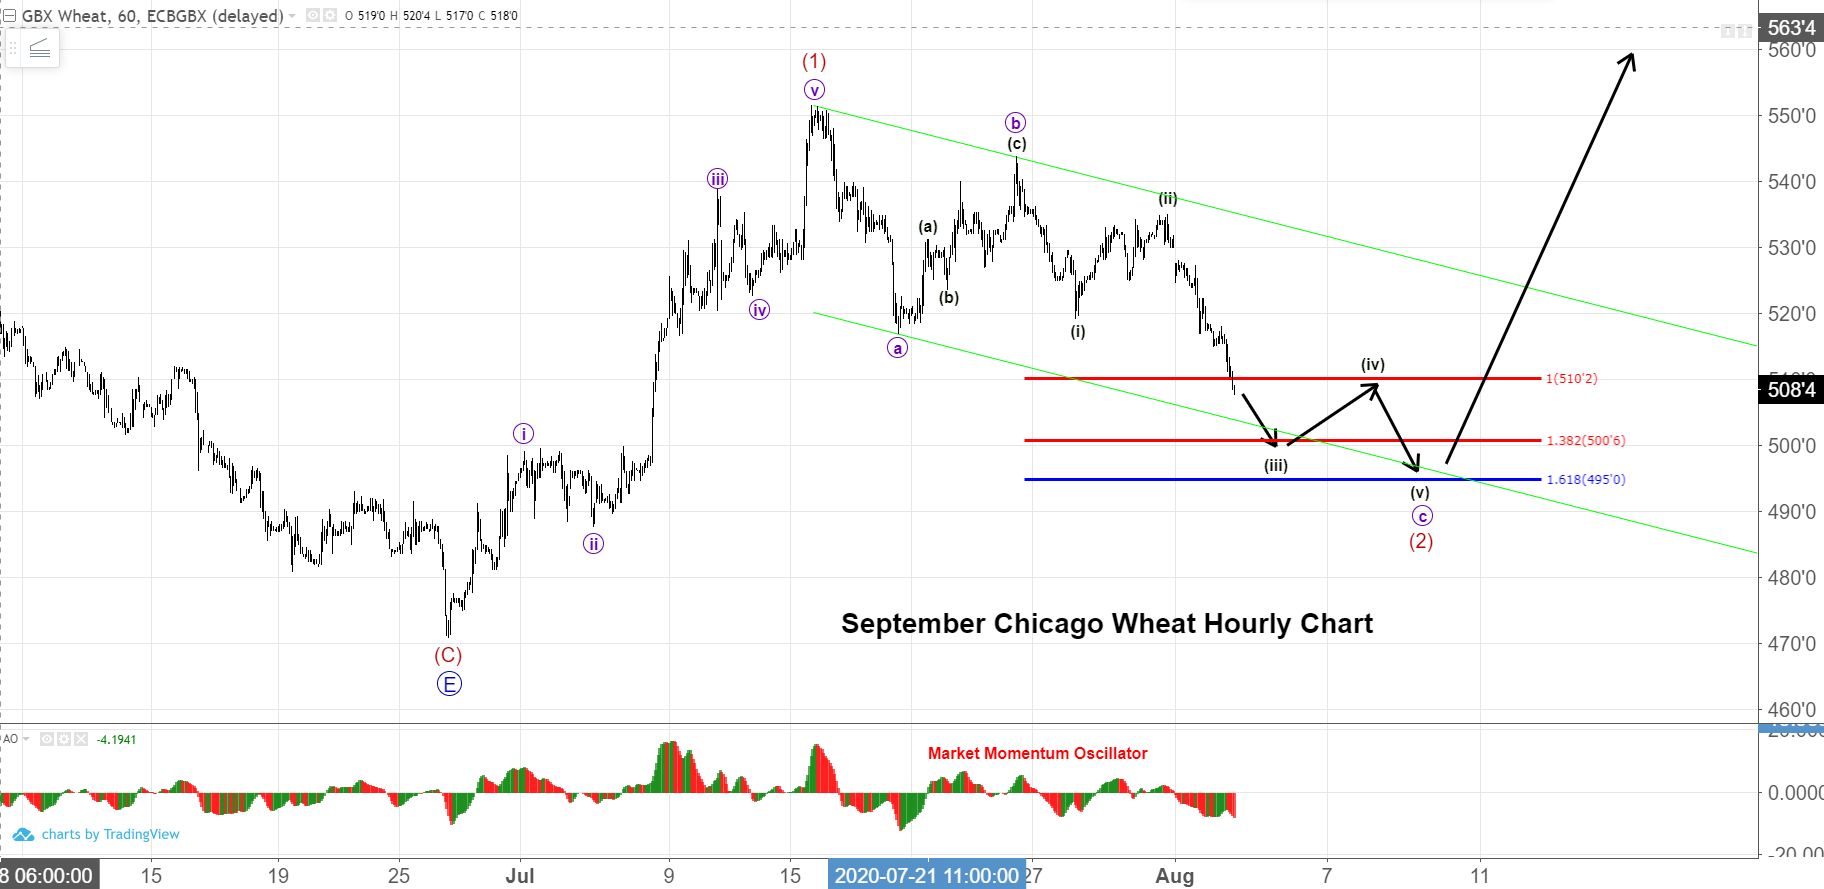
Here is the expected substructure on the hourly chart with the most probable path for prices.
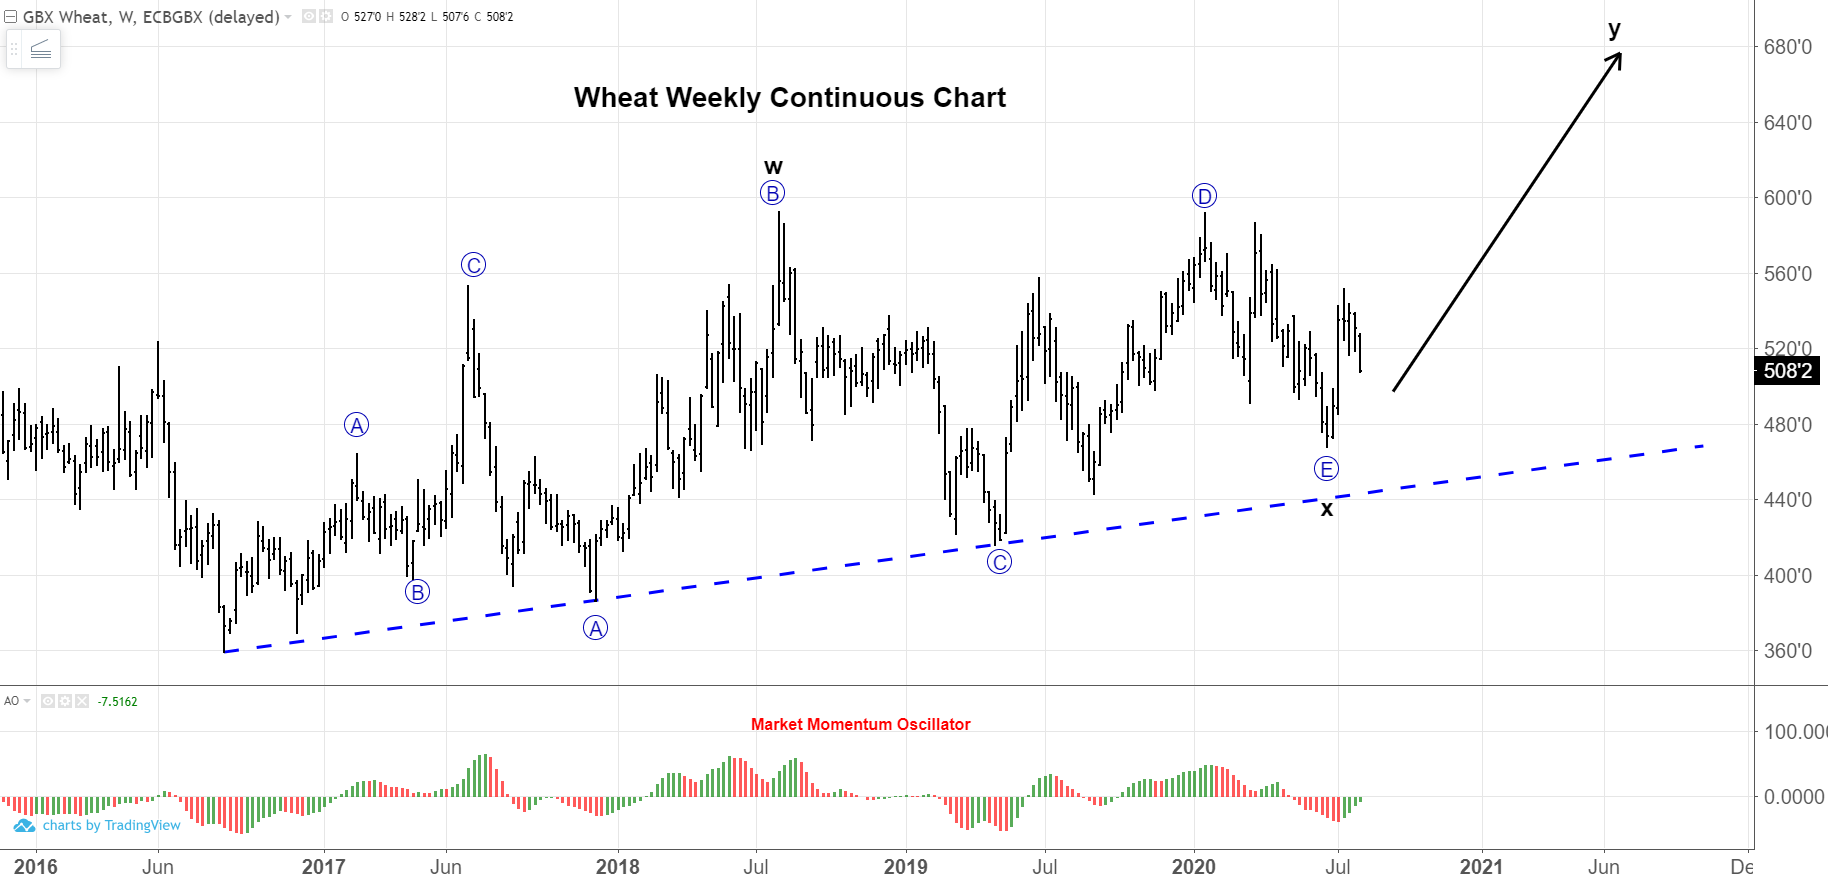
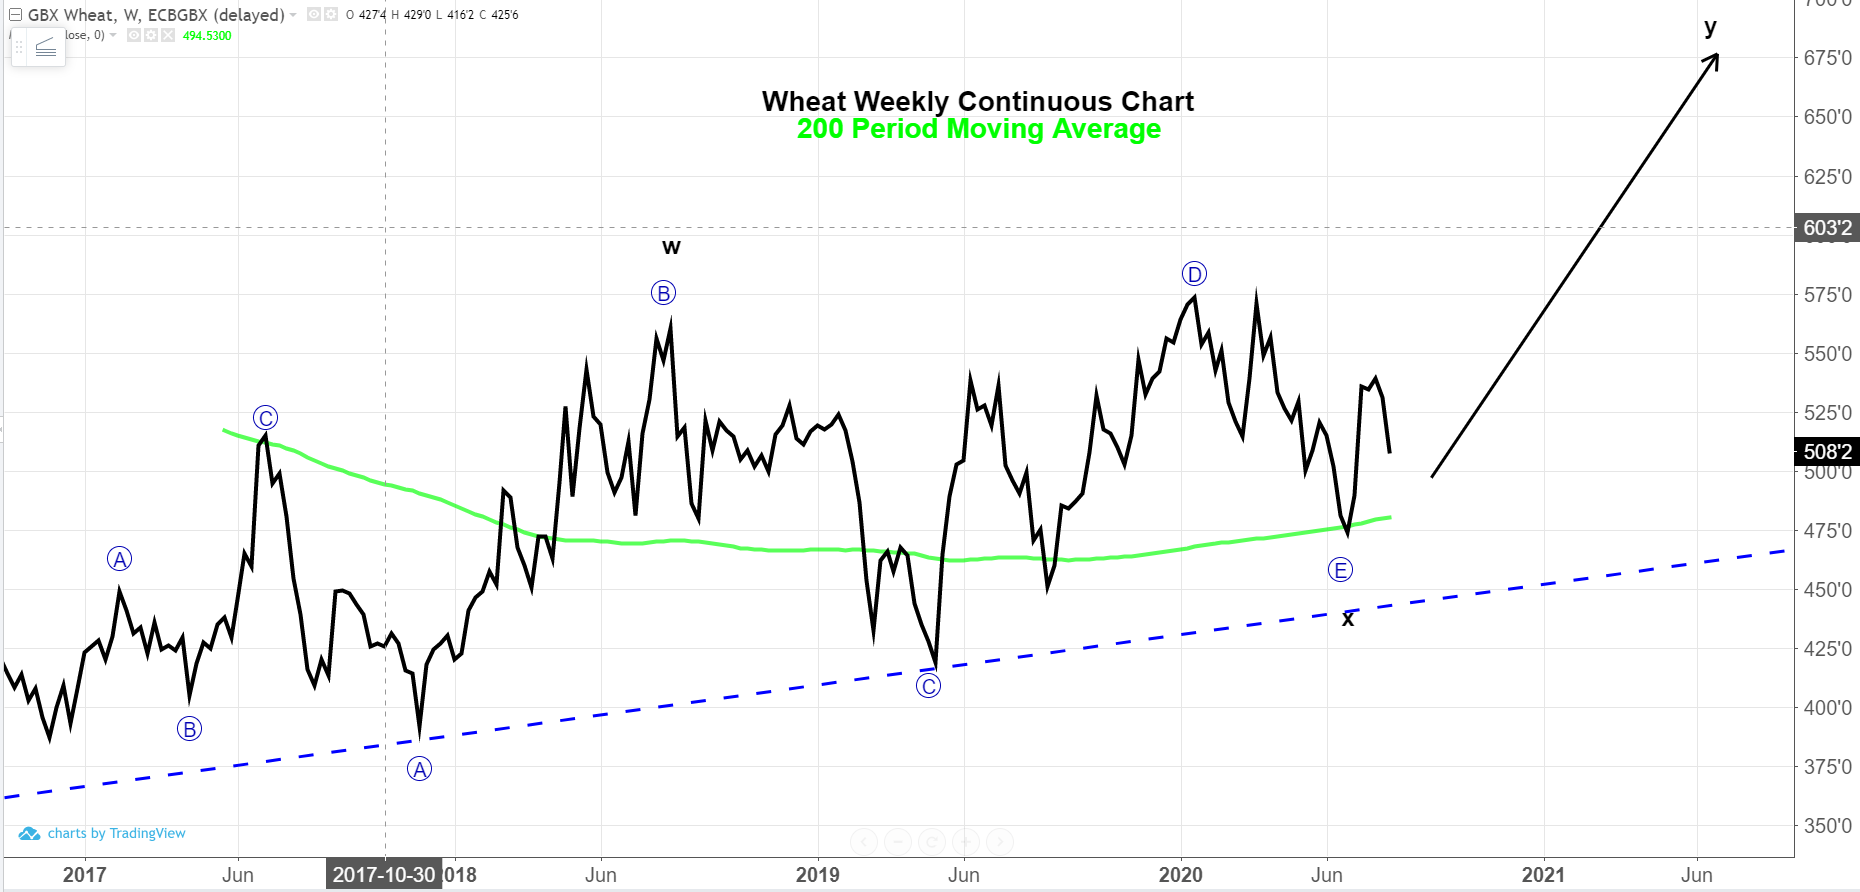
The weekly chart illustrates a well-established long-term trendline, along with the eventual upside target of +$7.00.
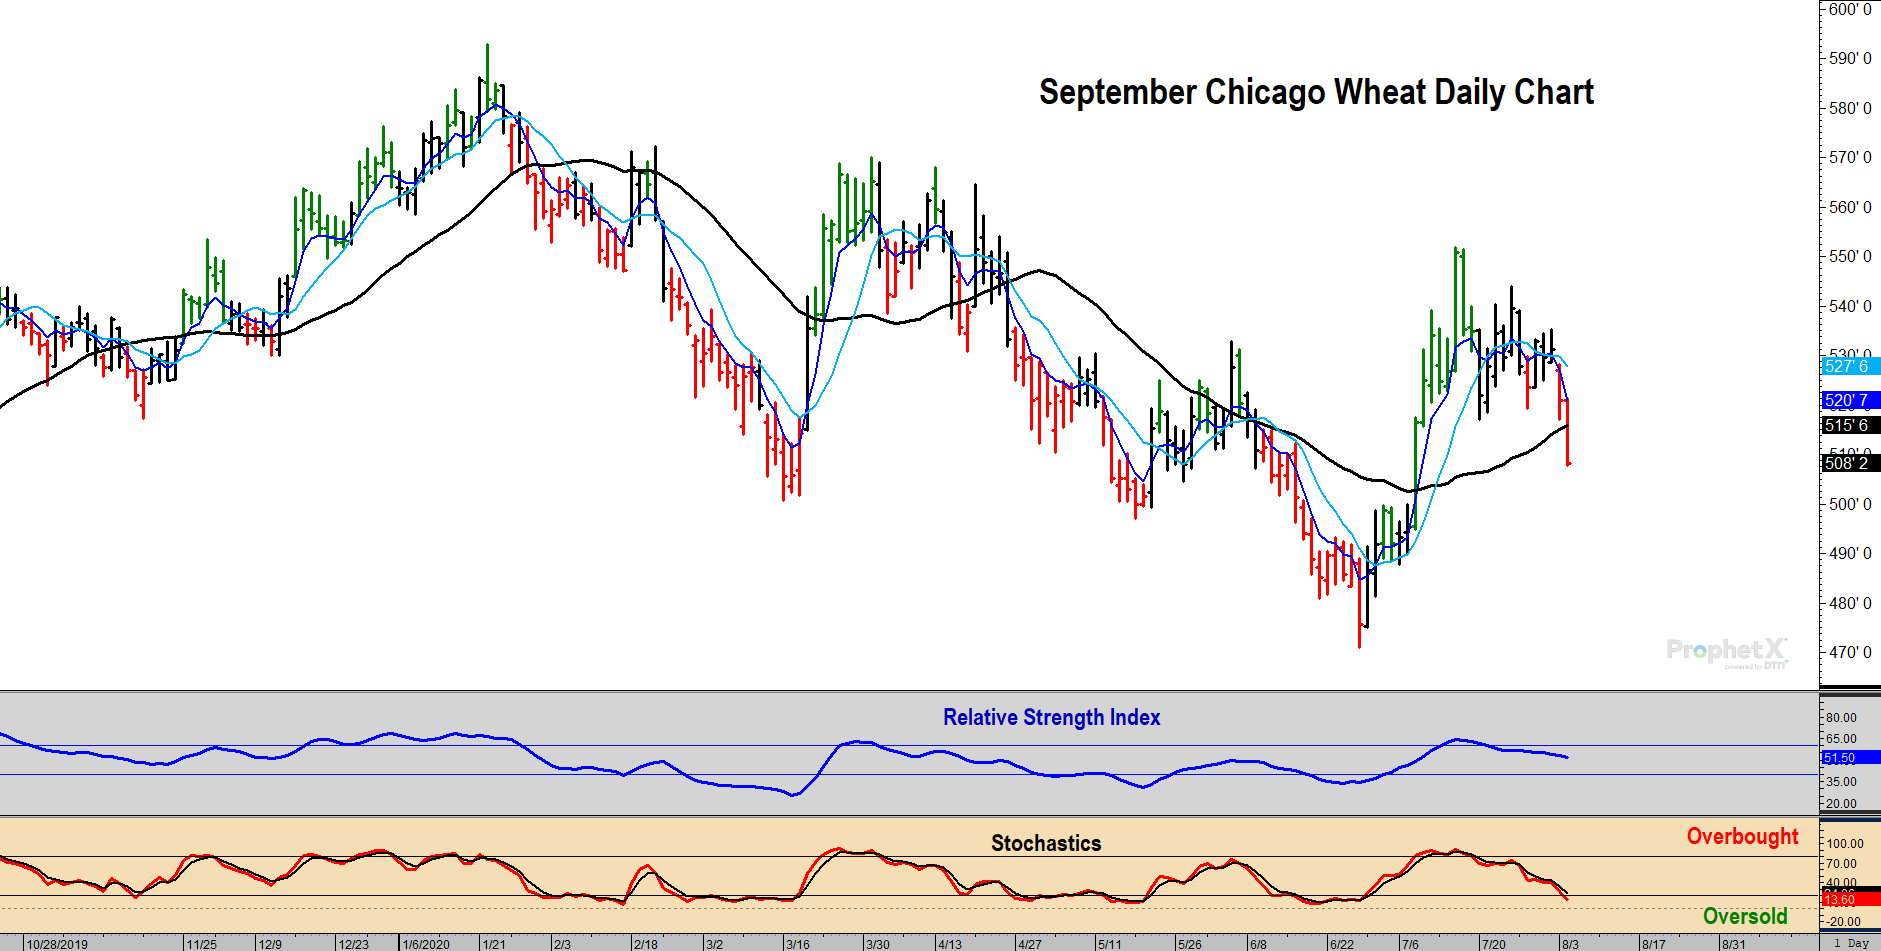
The relative strength index moved above the 60-level on the wave (1) rally. This is a good indication (not foolproof) that the long-term downtrend is over. Look for the 40-level to act as support as wave (2) plays out and provides a buying opportunity. Stochastics are in oversold territory, but that can remain for some time. If they are still in oversold territory when a complete wave (2) is carved out, it adds confidence to pulling the trigger.
On the long-term chart, look for the 200-period moving average to act as support as it has on two previous occasions since the slope turned positive back in June of 2019.
The Wheat Buyers Perspective:
Long-term trend has turned up. If prices accelerate below the trend channel illustrated on the daily chart, perhaps a new wave interpretation will be warranted. However, given the upside price targets and their magnitude relative to the previous market lows, good risk-management would be to take advantage of the suggested wave (2) pullback to add coverage.
Wheat Futures Fundamentals:
- A combination of improving crop estimates in Russia as well as strong anecdotal harvest reports out of the Northern Plains seemed to weigh. In addition, improved chances for rain in the wheat growing areas of Australia will keep production estimates rising there.
- Production ideas of 27-30 mmt for Australia are now being thrown around vs. the USDA at 26 mmt and 15.2 mmt last year. Australia’s largest wheat crop on record occurred in 2016/17 with 31.819 mmt harvested.
- The USDA said spring wheat conditions improved to 73% G/E vs. 70% expected, 70% G/E last week and 73% G/E last year. At this stage of the year, improving condition ratings are almost surely tied to better than expected yield reports. Spring wheat harvest was pegged at 5% complete vs. 10% average with South Dakota the most advanced at 35% complete.
- Winter wheat harvest is wrapping up at 85% complete nationally vs. 81% last week and 88% average.
- Quality of this year’s HRW and HRS crop is very good and well better than each of the last two years.
- Weekly export inspections totaled 18.4 mb vs. the 17.0 mb needed weekly to hit the USDA forecast. Inspections are up 9.4% from a year ago.
- Wheat prices will need to see steady export demand, especially to China, to help offset the rising supply narrative.
